
Day 288 of Self Quarantine Covid 19 Deaths in U.S.: 329,000 GA Vote!!
I am a sucker for interesting visualizations. A Chirpty twitter social network view showed up in my Twitter feed. I couldn’t resist. I had to generate my very own.
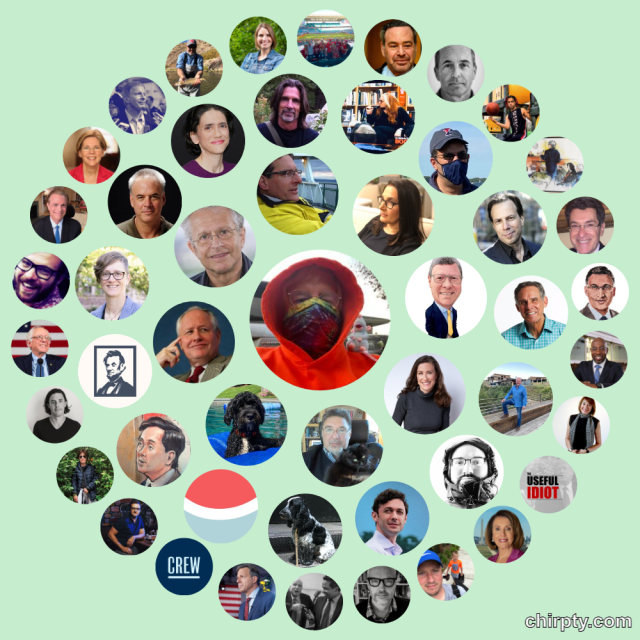
Yes, all of the faces or symbols are folks I follow. In fairness, I never really used Twitter until about four months ago when I started doom scrolling each day for an hour or two. Most of the images are of pundits or thoughtful folks I like and retweet quite a bit. Chirpty even reinforces my doom scrolling habits by providing what I jokingly call my “Three circles of hell.”

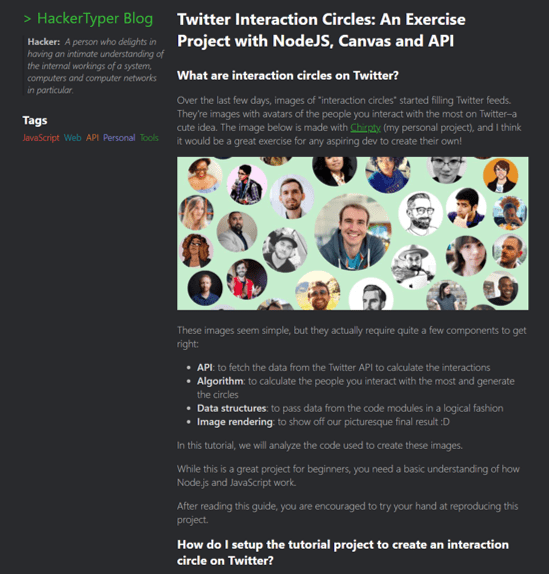
In the wonderful gifting of the Internet hackers, there is a blog post on how to develop your own Chirpty.
It is interesting to see Chirpty show up at the same time I was writing about the Social Networking visual analytics we built over the last decade.
In addition to the semantic network visualizations of Document Mapper, we also used the meta data in email messages to create social network and event network visualizations. To see more of the Ringtail analytics like social network and financial transaction networks here is a video I did for a conference in 2017:
The video is 13:30 minutes long with the financial network analytics starting about 8 minutes in. If you want to read rather than be shown the demo, here is a text description of the Ringtail Network Analytics.
A couple of grad students at MIT developed a surprisingly useful social networking demo called Immersion. The pleasant surprise was how quick it generated the social graph from the hundreds of thousands of my Gmails.
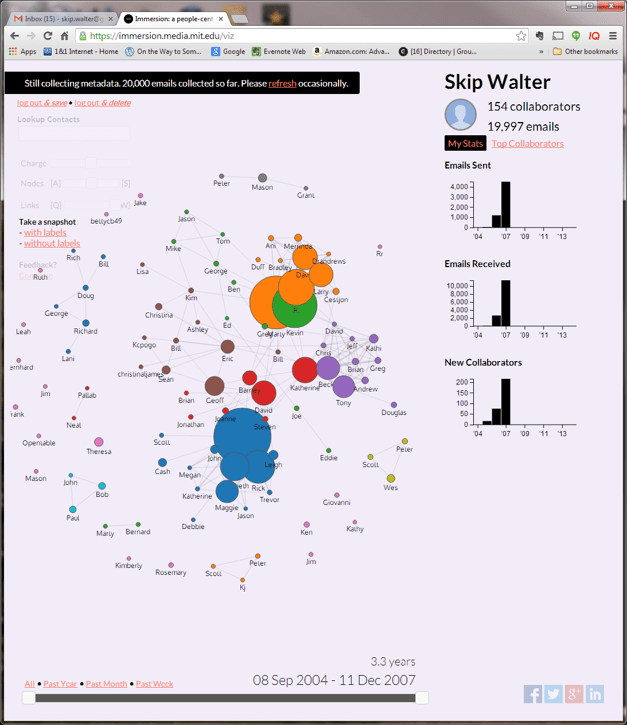
You could look at who you communicated with and the amount of communication at any point in time.
You could also click on one of the people and see who else you communicated with when you emailed that person.
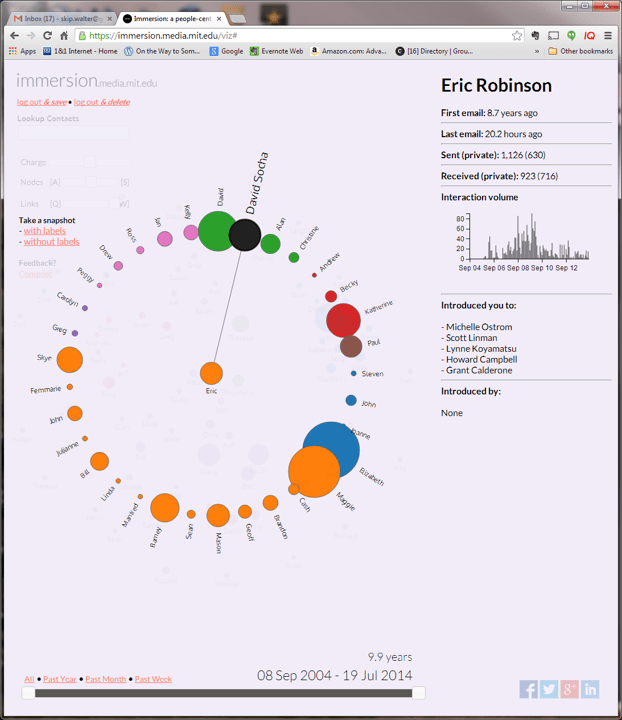
A really nice feature on the right pane is who that person introduced you to through email.
Ronald Burt through articles and books introduced me to the field of social network analysis. Burt’s descriptions of structural holes in social networks was especially helpful for using social network analysis to improve organizational functioning.
With a little searching you can find several articles on social network analysis and tools for social networking visualizations:
- Social Network Visualizer
- Top 30 Social Network Analysis and Visualization Tools
- Social Network Visualization: Can We Go Beyond the Graph
- SocioViz
- Social Network Analysis and Insights
Most of these tools use “dots” to represent people. It is such a joy to see tools like Chirpty and MentionMapp show the people in my life.

Wishing you all and your social network a joyous holiday.
