
Day 129 of Self Quarantine Covid 19 Deaths in U.S.: 143,000
Measuring the Path Forward

Flip Comic created by David Robinson
“A parable: A man was examining the construction of a cathedral. He asked a stone mason what he was doing chipping the stones and the mason replied, “I am making stones.” He asked a stone carver what he was doing. “I am carving a gargoyle.” And so it went, each person said in detail what they were doing. Finally he came to an old woman who was sweeping the ground. She said “I am helping build a cathedral.”
“Most of the time each person is immersed in the details of one special part of the whole and does not think of how what they are doing relates to the larger picture.”
“Would you tell me, please, which way I ought to go from here?”
“That depends a good deal on where you want to get to.”
“I don’t much care where –”
“Then it doesn’t matter which way you go.”
― Lewis Carroll, Alice in Wonderland
Milton Freewater, Oregon USA August 10, 2013
Dear Mikhail,
I am enjoying the opportunity of touring Washington and Oregon wine country with friends. It is a warm joy to wander through the vineyards of ripening grapes and imagine the stories that will emerge as the grapes ripen into wine in the cellar and then go to the many tables of their consumers.
I enjoyed reading through the fruits of your opportunity bringing in your latest email. I am not qualified to judge which is the best opportunity. I am glad you were able to notice the difference in energy levels when you use the Bringer of Opportunity Frame versus the blame or problem frame. I particularly liked the number of experiments and the results that you got with your social media “about” exercises.
Now we need to discuss metrics.
One of the gifts of watching our daughters go through their pregnancies and through the raising of our two granddaughters (Alice and Hazel) is seeing how child rearing changes with each generation. Through the dimness of time I can barely remember anything other than being exhausted in the months following the births of our three children. And my wife was far more exhausted than I was.
With the advent of the ever-present mobile phone, not only are our granddaughters part of the most photographed and videoed generation ever (sometimes I think they believe all adults have an iPhone sewn to their hands), they are also the most data recorded generation. Whenever our granddaughters eat, poop, sleep, cry or do their next “first” there is an entry in one of the mobile apps.
These miraculous devices also instantly connect our daughters to their social networks of new parents, many of whom are also awake and connected all hours of the day. As all of this data goes to the cloud and serves as an augmented life logging source for researchers (and advertisers) in the future, I can’t wait to see what patterns they unlock.
Since most of the products we build today, whether software or physical, have embedded usage information, we have mountains more data available to us to understand how a product is used. Yet, what is most important is to figure out is what is most important to measure.
Adrian Slywotzky in How Digital is Your Business? identifies three imperatives for capturing information about your customers in order to:
- Move from guessing what customers want to knowing their needs;
- Move from getting information in lag time to getting it in real time;
- Move from burdening talent with low-value work to gaining high talent leverage.
These three imperatives should guide your observations while you are doing your user research as we talked about in the “designing” email. A key part of your observations should be identifying the metric that will drive your product and business evolution.
When we started Attenex, we picked two legal markets to serve – the legal contract drafting market (Attenex Structure) and the litigation market (Attenex Patterns). Both products were guided by Slywotzky’s third imperative – moving from burdening talent with low-value work to gaining high talent leverage.
Attenex Patterns used visual analytics to increase the productivity of legal document review by at least ten times. The formal definition of visual analytics is the use of interactive information representations to shape and control an analytic reasoning process. Sean McNee summarizes the visual analytics process in this diagram:
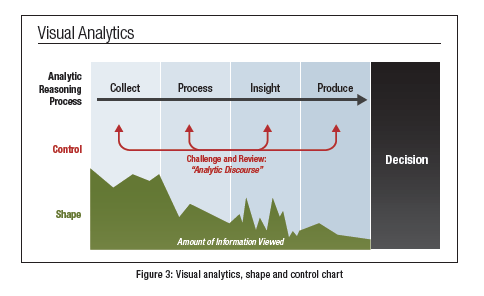
Early in the product development process we realized that our key metric for Attenex Patterns was how many “document decisions per hour” a lawyer could make with our software versus our competitors tools. We went beyond the eye candy of most visualizations to Deming’s mantra to understand and control our process. Document decisions were the end result of the eDiscovery process.
With the document decisions per hour metric we could quickly test any new features we wanted to add to the product. Every time we added a new feature we would see how many document decisions per hour occurred. If we increased the document decisions per hour then the feature stayed in. If we decreased document decisions per hour, the feature was pulled out.
In the first five years of Attenex Patterns product development we developed at least 350 different prototypes. About 40% of the feature innovations improved our “document decisions per hour” and stayed in the product. The rest of the features were removed.

In the above diagram you see fifteen of the prototypes we quickly iterated through. At the very center of the prototypes on the left you can see our first 3D interface. As good technologists we felt having three dimensional views would be great (like PNNL’s IN-SPIRE had suggested). We observed that lawyers (and most humans) cannot understand abstract 3D unstructured document spaces. So we shifted to representing multiple variables in a two dimensional interface. This interface worked great and with Patterns V2 we launched the product publicly and regularly achieved >10X productivity improvement over our competitors linear review tools saving our customers millions of dollars per litigation matter.

After 300 prototype iterations, we released V5 of Attenex Patterns. Each dot represents a separate document in the right hand semantic network window. On the left hand pane we have the organization side of the email address in a social network view for the same set of emails. An email address provides both the identity of the individual and their linkage to their organization. Both types of social networks are available for viewing. Each of the two window panes has referential integrity. In this case, I’ve clicked on the linkages between Preston.com and Yahoo.com (the yellow arcs in the left pane). In the right hand pane, all of the emails that were exchanged between Preston and Yahoo are highlighted in yellow. As I roll over each cluster of documents I can see the topics and subject lines of those email addresses to quickly see what the communications were about. In this case the discussions were around Acme Construction.
At the urging of Andy Cargile, one of my favorite students from the Institute of Design, we tried an Xbox Controller to navigate and “shoot” the documents to categorize them. We’d returned full circle to my 1968 midnight vision of shooting documents like I shot spaceships playing Spacewar. Our production tests showed that we would get an additional 1X performance improvement over baseline (advancing us to 11X productivity).

Xbox controller Interface
Try to imagine us going to New York City’s largest conservative law firms and selling them on their lawyers using a game controller to improve the productivity of their review. This feature was the only productivity improvement we had to pull out of the product. Playing computer games just doesn’t fit with the culture of Big Law.
With the rapid advances in our human centered design and metrics driven process, we demonstrated that we could create value for all of the participants in our electronic discovery value chain. Over the course of five years, we dramatically reduced the cost of reviewing 300GB of documents.

With the improvements in our technology we were able to achieve large gains for our end customers – the Fortune 1000 corporations involved in high stakes litigation. Prior to our product, 300GB of material (if printed out in bankers boxes they would occupy an entire Sears Tower) took 200 attorneys a year to review.
My favorite example of the product power was the high profile Board of Directors investigation in 2006 where the lead law firm partner realized on the Friday before a Monday morning Congressional Committee appearance that they were going to have to go through all 300 Gigabytes of material, not just the small sample they’d reviewed previously.
The law firm hurriedly called in 65 attorneys from associates to senior and retired partners to spend the next two days reviewing all 300GB of emails. Most of these lawyers had never seen our software prior to this emergency. They learned the product, did the review and printed the responsive documents to make a midnight Sunday plane from the Bay Area back to Washington, DC. What an improvement from 200 attorneys working for a year to review the same amount of material.
The astute among you will be asking the question, why is this a great business if you’ve done such a great job decreasing the costs for your end customers?
And the answer is – the amount of electronic information to review expands faster than the rate at which we increase productivity. What a nice business ecosystem to be in. Last year the industry had its first Petabyte case – that would be 3,000 Sears Towers full of banker’s boxes.
While we were quite excited about the ability of metrics to drive our product development for Attenex Patterns, we could never find a metric to guide the development of Attenex Structure. We had very early sales success with Attenex Structure with Microsoft, 3M and Fair Isaac. Even with all our instrumentation in the product and our testing of prototypes, we could not find a metric that would let us know if a new prototype helped or hurt a user’s productivity. Without a metric, we could neither improve the product nor could we easily sell the product by having evidence to back our productivity claims.
Productivity is often equated with do it faster. Attenex prioritized its research and development efforts to find and solve those problems where we could achieve at least ten times productivity increases. Productivity is a complex interaction of “better, faster, cheaper” with ever increasing quality (six sigma) and improved business relationships (customer, supplier, partner). To improve productivity it is important to have key metrics that are measurable and can be made visible for all parties. We wanted to ensure that each feature that we added to our products improved the overall measures of productivity for our users, purchasers and influencers. Productivity increases would include the balancing of machine improvements and user level improvements that often times are non-obvious. For example should we spend more machine time on identifying near-duplicates (reducing our throughput) in order to reduce the amount of documents that an attorney has to look at (decreased human labor)? Identifying key metrics and then making it painless to track the metrics and identify patterns is the focus of measuring your way forward.
The major types of productivity improvements can be classified as:
-
- Faster
- Reduced cycle time – the overall number of days, weeks or months it takes to complete a project from beginning to end
- Reduced process time – the total number of hours consumed in producing the end work product
- Reduced learning time – the amount of time a user requires to achieve proficiency in a particular area
- Better
- Cheaper
- Increased quality
- Improved relationship quality with customers, suppliers and influencers
- Risk Management
- Increased Reward
- Faster
Recently, I worked with Daniel Kornev of Zet Universe to help him gain insights into his target market and what metrics might guide his product development. Daniel described his product as a file organization tool for visual thinkers. Visual folks often get frustrated with the lists of lists that Microsoft Windows and Macintosh OS folder based file systems present and our search tools generate. As I listened to Daniel talk about the customer interviews, he mentioned several times that with Zet Universe users could quickly move from one project to another.

I repeated what I’d just heard. “Daniel, listen to what you are saying. I heard you say that you’re not looking for visual thinkers. You are looking for knowledge workers who work on multiple projects during the course of the day and have to switch between those projects quite often. Is that your target market? If so, you also have your key metrics – time to switch between projects (close one down and open up all the files associated with another project). It’s the switching time that you are dramatically reducing. This metric will also keep your development focused on what features to add. You can do the same thing that we did with Attenex Patterns.”
I can’t wait to see how Daniel moves forward with his metric insight.
As more of your product is digital and you instrument your product, you are ready to move to key metrics for measuring your marketing and selling initiatives. John Wannamaker shared “Half the money I spend on advertising is wasted; the trouble is I don’t know which half.” With the advent of digital marketing and social media it is getting easier to test which activities matter to your target customers.
Ash Maurya with his Leanstack product for testing your marketing activities illustrates this problem nicely with these images:

With all of the tools that we have today it is easy to get lost in the minutia. Along with the metrics, you also want to remember why you wandered into the swamp of metrics – to generate insights that will allow you to provide extraordinary value to your customers.
Padraig at Red Kite Prayer shares a story of how paying attention to minutia can detract from your overall goals:
“I used to have a cyclocomputer, a not very fancy one. It told me how slow I was going. It gave me my average lack of speed, my top slowness and the paltry total distance I’d covered. I hated it.
“Of course when I first affixed its magnet and wired its sensor, I was excited. So this is what 25mph feels like. So that’s how far it is from my house to the end of my second water bottle. All this new information was fascinating. I used it to formulate boasts to friends about how much further I was riding than they were and how much faster I had climbed this hill or descended that one. I used it to measure my progress from the chilly beginnings of spring to the stiff breezes of leaf strewn autumn. And on some level, I just accepted that this was part of the equipment, part of the way you rode a bike.
“Last summer, Wired told me about the boom in personal metrics measurement. Suddenly this trend that cycling has been following for years was spreading and “booming.” People loved and felt inspired by statistics. And with the proliferation of devices from Garmin and others that would quantify your work in dozens of different ways and allow you to make bar charts and graphs and multicolored pie representations of your everyday grind, who could blame them?
“Why generate sweat when you can generate stats?
“One day, about two years after I’d purchased my first such device, I was struggling into a headwind up a false flat staring down at its digital readout. 14.1 mph. Grunt. Groan. 14.2 mph. Muttered curses. 14.3 mph. Pain. Strain. Incredulity. 14.1 mph. Back and forth like this for a few minutes, all the time with my head down, all the time bouncing between 14.1 and 14.3 mph, in other words, working hard for no real gain with my head down and a growing frustration.
“At some point, I had a revelation. I reached down, unplugged the computer and slid it forward out of its bracket, depositing it in a jersey pocket, before lifting my head, seeing both the forest AND the trees and riding off on my merry, if deeply fatigued, way.
“I realized in that moment that I had, at some point over the preceding years, ceased to ride my bicycle. I had begun to ride my computer, and, in the end, it had ended up riding me. I had stopped collecting experiences on my bike and resorted only to collecting statistics. Perhaps worst of all, I had stopped seeing where I was going. I was the computer. The computer was me.
“Computers don’t ride bicycles. They compute.
“It was shocking to me how much more I enjoyed riding once I stopped measuring my rides. I became more aware of my form and position on the bike. I live in a beautiful part of the country, and I began to see it. I got faster, if not in actual digital terms, then certainly in my heart, because I felt faster. I swore then to reaffix my computer only after deep and careful thought about what doing so would get me.
“A Zen master once said, “When you are drinking tea, only drink tea,” and, for me, this applies to the bicycle as well. When I am riding my bike, I try only to ride my bike. I don’t concern myself with speed, fitness or progress. Those things are elusive. They come and go. When I ride, I become fit. I progress. I go fast. Except when I ride myself right out of fitness, speed and progress. The form dips and swerves. The consequences of my riding change and shift, but the riding is always there.
“For me, measurement started as a curious and entertaining diversion, but ended as an obstacle. Somewhere along the fault line of the pro-hobbyist divide, technology and science have interceded. Those who wish to race, if not professionally, then certainly as the pros do, have followed them down the statistical path. It is, perhaps, a hobby within the hobby, neither bad nor good, but simply another thing you can do with your bicycle.
“I’ve left it far behind now. Occasionally I wonder exactly how fast I’m going, but the thought passes. I’m going fast enough.”
One way I’ve found to re-focus the product marketing and development teams is to periodically ask them to improve the performance of the product or of our marketing activities by at least 10X. I learned this lesson many years ago while working on ALL-IN-1. When I asked the software developers to improve performance by 10% I would get improvements ranging from -10% to +3%. I never came close to a meaningful improvement.
Then one day out of utter frustration I asked for 10X performance. Within two weeks the team had improved performance by 500%. I couldn’t believe it. What changed? As we did an after action review, we realized that by asking for a 10% improvement the developers just made minor changes. When asked for 10X performance, the developers knew they had to think differently about the opportunity. They had to think outside the box.
I was delighted to find that this technique also works for marketing.
Yours in entrepreneuring,
Skip Walter
