Day 194 of Self Quarantine Covid 19 Deaths in U.S.: 201,000
Rest in Peace Justice Ruth Bader Ginsburg VOTE!!
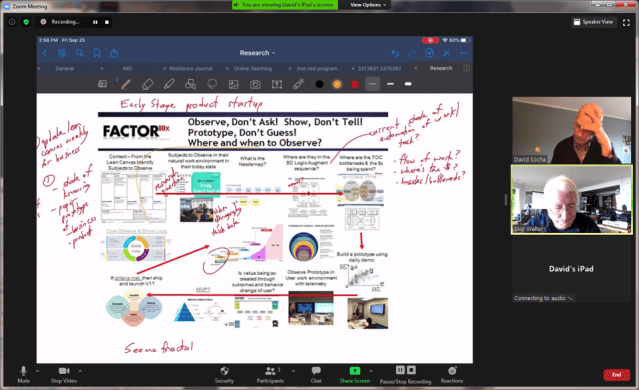
After reading the first post on “Observe, Don’t Ask,” Professor David Socha asserted “this post still begs the question of where do you observe. Can you create a diagram for where to observe?”
A longtime colleague and collaborator, Eric Robinson shared:
“I like Kelly Franznick’s story. The implications of that story go all the way back to product architecture and designing for the purpose of observability. How do you make observability a core component of the product? What if it had been a client-installed, on premises, monolithic application? The engineer couldn’t have the quick turn around and put changes in front of the users for the next day’s ethnography cycle.
“And the ‘action logging’ was critical (not just ‘system logging’). The ability for the software engineers to see the problem directly from the logs and prove the existence of the problem is powerful and immediate. How often have we seen stories come into the product backlog from anecdotal information and have an engineer say ‘that’s not a problem’ and the agile user story gets dropped? The metric should be ‘how long does it take us to find out the client had a problem?’ The unit of measurement should be seconds or minutes, not days, weeks or months.
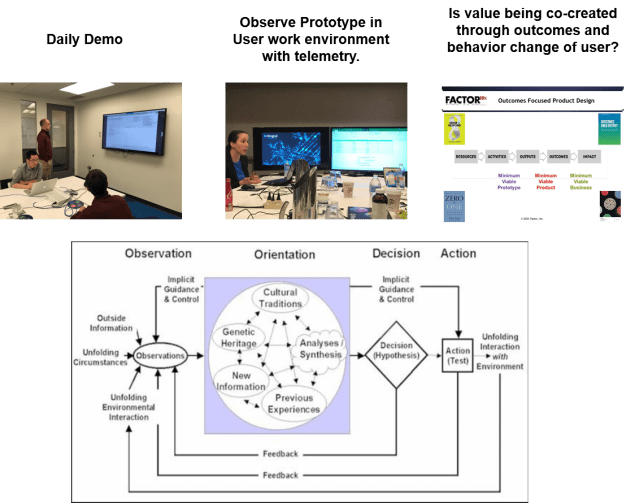
“Continuous Integration, Testing and Deployment (CI, CT, CD) are prerequisites for Continuous Observation. The Daily Demo is a software engineer and product-centered approach — which is probably the best thing you can get quickly without daily access to a real user. However, these questions are always present:
-
-
- Are we helping the customers (improving their lives, adding value, etc)?
- How do we know?
- How do we get the feedback?
- How soon can we know?
“The opposite of these questions also need asking — did we decrease value, or create a problem, etc?”
After I prodded Professor Socha to tell me more, he went on to explain what he meant about “where to observe?”
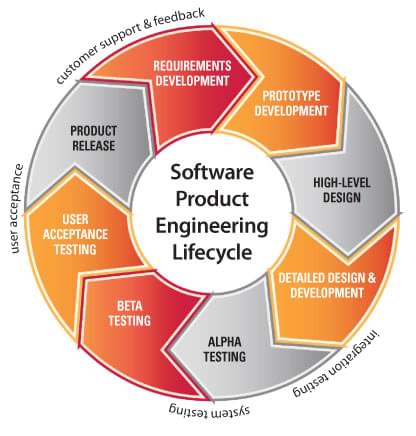
“My understanding of waterfall is that is framed around the use of documents (mostly text, sometimes diagrams) to communicate what is important for the people who do the actual work. Marketing and business analysts would work with customers, business executives, and other stakeholders to figure out what is most important to provide to customers and the business, and then record that in a document. The document is the product of “requirements elicitation”. It seems that business folks often use a slide deck to communicate such things. While there inevitably is some collaboration involved, and some back and forth discussion, the product of this phase is all about “sage on the stage,” broadcast, and “unambiguous” descriptions.
“Part of the frustration that provoked Agile methods is the myth that such documents communicate well. Few people actually read a hundred page specification document, unless they are embedded in systems like Boeing aircraft design where those documents are taken to a much higher level of rigor and analysis. Bill Erdly talks about how he was involved in using ALL-IN-1 to automate the production of their Boeing proposals so that they could keep making changes up to the last hour before pushing the button and printing a huge document (many thousands of pages) that they would then ship off to DC with one copy on a plane (to get there in time) and the rest on several pallets sent by rail. Their system did all sorts of computation on the data, creating summaries from the raw data, doing cross-checks, etc. It was document automation in the large. And given the regulatory environment and the physics of the domain they were working in, such analyses captured in the documents could represent some goodness.
“This is different when it comes to products that are about delivering adaptive human experiences, the stuff of software-as-a-service etc. Especially different are products that have to scale and adapt to the emergent needs of many varied contexts. In those cases, no document will be correct. But a document represents a hard, reified “truth” that is harder to modify. Or to understand. Which then requires the creation of all of these change-control mechanisms to ensure that any document changes are “correct” and “good”.
“Okay, I’m blabbing about the maladies of documents. Let me return to your question.
“Where to observe?
-
-
-
- in naturalistic contexts where customers or customers’ customers are doing their thing. That’s the whole decades-old message about taking your software engineers to the field with the customer support team so they can observe and listen to what the actual customer does, and how the customer service representatives address the issues / opportunities / things that come up. But software engineers tend to want to stay in their offices and “be productive”. And there’s always “too much work to do” to justify the day it takes to send them into the field. Besides “it’s too dangerous” sending a software engineer, cause they will say the wrong thing or act “too nerdy” and put off the customer.
- in the user research lab (vs reading Blink’s report a month later).
- walking the hallway as a manager to hear the conversations, or to bump into people to have spontaneous conversations (was it Cutler at Microsoft who talked about planning to take hallway walks at just the right time to meet so and so so that he could have such and such a “serendipitous” conversation about an issue at hand?)
- being in the room with your cross-functional team, both as a team member and as the team manager. To be more creative (see this interview by James Shore about how distributed software development work requires 30% more software developers to get the same level of creativity as when collocated). Software development is a creative industry. Creativity is as important as productivity. Bjorn also highlighted the need for junior developers to be in the same room in order to learn. Remember, Vygotsky notes that all higher-order concepts are social first, so we need to build in the social if we want to get to higher-order concepts. (There, do you feel better now that I’ve mentioned Vygotsky?)
- when prioritizing features, make sure you can show the current state of a feature, what it actually looks like. That can help the conversation focus on what part of the thing really needs change now, and what parts can be left as they are for the moment.
“Jointly seeing and discussing helps satisficing, aiming for Good Enough. See Bach’s seminal article on A Framework for Good Enough Quality: Beyond the Buzzword (available here along with related articles). That framework generalizes to any context of satisficing; one just has to have the hard conversations about what is critical, etc. Here is the good enough definition from that article:
“To claim that any given thing is Good Enough is to agree with all of the following propositions:
-
-
-
-
-
-
- It has sufficient benefits.
- It has no critical problems.
- The benefits sufficiently outweigh the problems.
- In the present situation, and all things considered, further improvement would be more harmful than helpful.
-
-
-
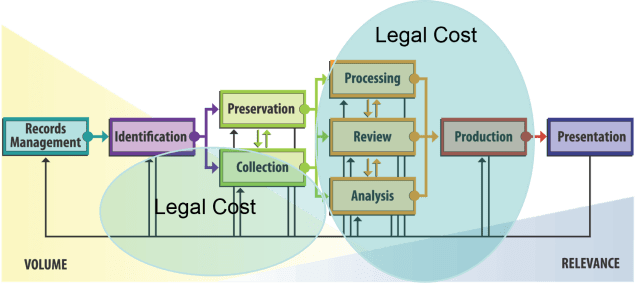
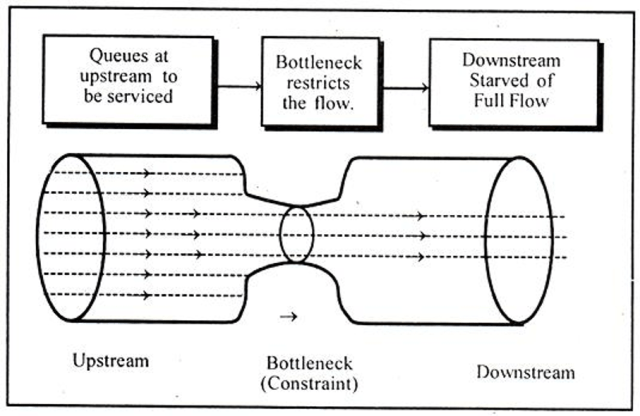
- after doing a change to see what the customer now does with the system. Like you did at Attenex. Cause human behavior is emergent. And customers often don’t do what we expect. It’s theory-of-constraints in the small.
- Daily demos
- Scrum and other agile processes that include end-of-iteration demos to team’s stakeholders
- when needed: “Hey Bob, can you come look at this? Something weird is going on here.”
- with product owner / business analyst / customer to check that what you have done with respect to a task / feature does what they expect / need / want.
- with QA person before declaring a bug fixed and throwing it back over the fence to QA; “does this align with what you expected?”
- when my wife says application X isn’t working, or how can she do Y on her computer, I’ve learned that the first thing to do is ask her to go to her computer and show me what she is doing (and stop talking at me about it). For instance, when she says “I’m using Outlook” does she mean the app running on her computer, or the Outlook running in the web browser.
- when my student on the other size of the Zoom call says she is doing it correctly, I ask her to share her screen. It’s uncanny how often I’ll find out that she is NOT doing what I asked her to do.
“Okay, gotta go off to do my day’s work. Thanks for the prompt. I’m sure there are lots of more places. But in typing this out, I’m seeing that the need for observe and show is all around. Words just suck. We both think we know what the words mean, but we often (usually) have different meanings. And then you introduce evolving technology where Microsoft Outlook can run in either an app or a browser, or that the version of the Outlook app running on my Mac is completely different from the version running on Caroline’s Mac, even though we both have updated to the “latest” version (perhaps UW Bothell has limited what my Mac views as the “latest”?), and that Mac versions are always different from Windows versions (etc. across any platform) and why should I EVER assume that application X that I see on my system has much to do with what the other person is seeing as application X on their system.
“So, the observe and show is about my day-to-day life at home. It is about teaching, especially now that we are remote and we cannot simply look over the student’s shoulder to see what they see. It’s about working with colleagues to develop a system. It’s about understanding the customer’s experience – cause the experience is a becoming (Ingold‘s term) of their lived experience, their physical materials at hand, their type of device, their version of software, their particular context of use, and the range of “brilliant” to “stupid” ways in which they are trying to do their work. “
David
After absorbing David’s thoughts on the “where” of user research, I Google searched for more on user observation. I came across Jim Ross’s “The Role of Observation in User Research.” He asserts:
“User research consists of two core activities: observing and interviewing. Since we’re most interested in people’s behavior, observing is the most important of these activities because it provides the most accurate information about people, their tasks, and their needs.
“While interviewing is also very important, the information people provide during interviews isn’t always accurate or reliable. Often, research participants don’t know why they do things, what they really need, what they might do in the future, or how a design could be improved. To really understand what people do, you can’t just ask them, you have to observe them.”
Ross goes on to list the types of observation in user research:
-
-
- Usability Testing
- Contextual Inquiry
- Naturalistic Observation
- Shadowing
- Covert Observation
- Participant Observation
“A naturalistic observation lets you to see what happens over a longer period of time, whether you’re observing one person or a group of people. You can see how a normal day unfolds without introducing your own interruptions or influencing participants. For example, while you might hear about particular problems during a contextual inquiry, observing participants over a longer period of time provides a better understanding of how often such problems occur and what causes them.”
At the end of Ross article, there is a pointer to David Travis and his book Think Like a UX Researcher: How to Observe Users, Influence Design, and Shape Business Strategy.
In the first couple of pages, Travis likens UX research to the work of Sherlock Holmes in detecting:
“Opinions are not facts and speculation is not evidence. Instead, his primary method of collecting facts was careful observation. ‘You know my method, Watson. It is founded upon the observation of trifles.'” p. 12
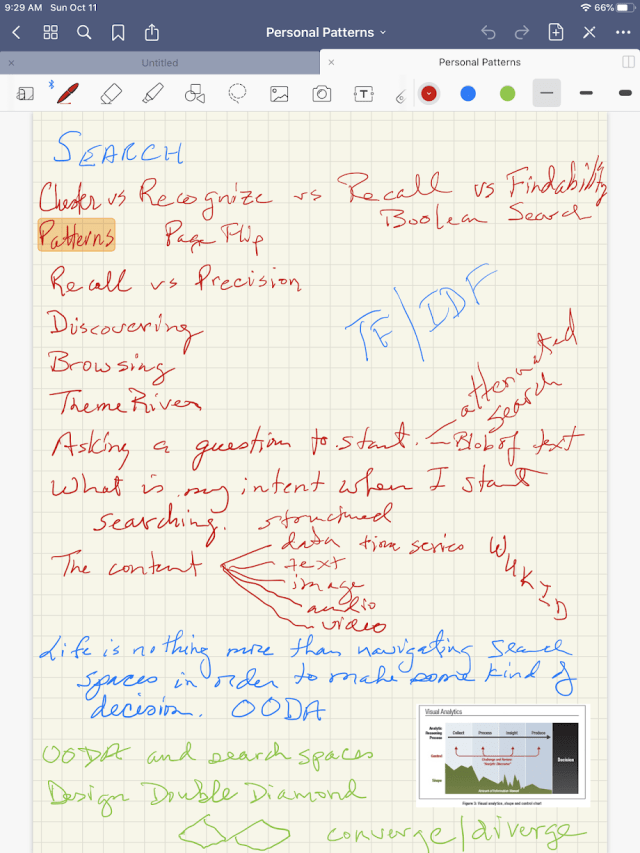
While I absorbed the fullness of the Holmes quote, I thumbed back a few pages to re-read why we do observation – to gain insights.
“The best way of gaining actionable and testable insights is not to ask, but to observe. Your aim is to observe for long enough that you can make a decent guess about what’s going on. Asking direct questions will encourage people to make things up, not tell you what is actually going on.
“There are two ways to observe. We can observe how people solve the problem now. or we can teleport people to a possible future and get them using our solution (a prototype) to see where the issues will arise.
“The key point is: What people say is not as useful as what people do, because people are unreliable witnesses.” p. 4
Travis goes on to provide excellent definitions of the problems of poor user research and the lists of what a user researcher should do.
The Seven Deadly sins of UX:
“The problem isn’t with the quantity of UX research. It’s with the quality: organizations struggle to distinguish good UX research from bad UX research. Here are seven examples of poor UX research practice that we’ve come across in our work with clients—along with some ideas on how to fix them.
• Credulity.
“The dictionary defines credulity as a state of willingness to believe something without proper proof. The form this takes in UX research is asking users what they want (and believing the answer).
The best way of gaining actionable and testable insights is not to ask, but to observe. Your aim is to observe for long enough that you can make a decent guess about what’s going on. Asking direct questions will encourage people to make things up, not tell you what is actually going on. There are two ways to observe. We can observe how people solve the problem now. or we can teleport people to a possible future and get them using our solution (a prototype) to see where the issues will arise. The key point is: What people say is not as useful as what people do, because people are unreliable witnesses.
• Dogmatism.
“Dogmatism is the tendency to lay down principles as undeniably true, without consideration of evidence or the opinions of others. The form this takes in UX research is believing there is one “right” way to do research.
• Bias.
“Bias means a special influence that sways one’s thinking, especially in a way considered to be unfair. UX research is a continual fight against bias. There are a handful of different kinds of bias that matter in UX research, but it’s response bias we want to discuss here. This is caused by the way in which you collect data.
• Obscurantism.
“Obscurantism is the practice of deliberately preventing the full details of something from becoming known. The form this sin takes in UX research is keeping the findings in the head of one person. UX research is often assigned to a single person on a team. That person becomes the spokesperson for user needs, the team’s “expert” on users.
• Laziness.
“Laziness is the state of being unwilling to exert oneself. The form this takes in UX research is in recycling old research data as if it’s boilerplate that can be cut and pasted into a new project. our favorite example of this comes from the world of personas. We find that clients often approach the process of developing personas as a one-time activity.
• Vagueness.
“Vagueness means not clearly or explicitly stated or expressed. In terms of UX research, we see it when a team fails to focus on a single key research question and instead tries to answer several questions at once. This sin is partly caused by the sin of laziness.
• Hubris.
“Last but not least we have Hubris. Hubris means extreme pride or self-confidence. In UX research, it takes the form of taking undue pride in your reports. All UX researchers suffer from this to some extent, but those with PhDs are the worst. And we say that as proud recipients of a PhD.5 UX researchers love data. And when you love something, you want to share it with people. So you create detailed reports packed with graphs and quotations and screenshots and callouts. Look at my data! Look at how beautiful it is!
“Overly detailed reports delay the design process. You don’t need to do extensive analyses in a spreadsheet to find the top problems. That analysis is useful later, when you want to dig into the details, but the critical findings need to be fed back quickly. This is so the design can be modified and so the build-measure-learn cycle can continue. Instead, you need to create information radiators (like usability dashboards and one-page test plans) to get teams understanding the data so they can take action on it. Information radiators are essentially advertising billboards that gradually permeate the team’s awareness of your results. As a general rule, if people need to turn the page, your report is too long. So ask yourself: how can we capture the results in a single glance? This could be a concise visual way of presenting research data, like a user journey map, a persona, or a usability testing results dashboard.
Information Radiator
An information radiator, also known as a Big Visible Chart (BVC), is a large graphical representation of project information kept plainly in sight within an agile development team’s shared workspace.
The term is generic rather than specific: information radiators can include most types of charts used in agile development. Burn down charts, task boards, planning boards and storyboards are among the possibilities. An information radiator is usually hand-drawn or printed but can also include computer-generated charts and electronic displays.
The purpose of information radiators is to help keep the team focused on what really needs their attention and to promote transparency.
Alistair introduced the term “information radiator” in his 2001 book, Agile Software Development. Martin Fowler is said to have coined the term “Big Visible Chart.”
Once more I feel like I have been asleep. I have never heard of Information Radiator before. I love it.
Think Like a Detective
“So what can we learn about doing UX research from the greatest detective of them all—Sherlock Holmes? Holmes was an investigator par excellence, but he was not a super hero (he did not have super powers). Instead, he had well-honed skills and specialist knowledge about a few things. And he was nothing if not methodical. His method comprised these five steps:
-
-
-
- Understand the problem to be solved.
- Collect the facts.
- Develop hypotheses to explain the facts.
- Eliminate the least likely hypotheses to arrive at the solution.
- Act on the solution.
“Here are some things we can learn from Holmes’s approach that can help our UX research thinking:
-
-
-
- Focus on the problem not the solution.
- Create an explicit research question (actually write it down with a question mark at the end).
- Don’t start doing any research until you have this question.
- Don’t assume the question has never been asked before.
- Find out what your colleagues and your company already knows.
- Do an archival search—start by reading any prior research reports.
- Interview team members and stakeholders.
- Use a checklist to collect background information in a systematic manner.
- Leave nothing to guesswork.
As I go through these definitions and lists, Travis answers my question of whether to have a hypothesis before hand. He answers “No.” However, you need to have a research question. One good question is better than hundreds of small questions. He suggests that it is more important to know a lot about a little, rather than a little about a lot.
“You may not get to wear a disguise or crawl about on the carpet with a magnifying glass, but here are some things we can learn from Holmes to improve our observation skills:
-
-
-
- Watch people actually doing their work—don’t just get a demonstration.
- Remember that your participants are the experts, you are the “novice.”
- Focus on the most typical tasks, busiest days, typical days, and critical incidents.
- Find out what activities precede and follow the task you are observing.
- Look for inconveniences, delays, and frustrations.
- Shadow people; follow them wherever they go.
- Point to things and find out what they are for.
- Get copies or photos of artifacts, samples, forms, and documents.
- Make diagrams of the workspace.
- List the tools people are using.
- Note people dynamics and interactions.
- Be alert to things happening simultaneously.
- Record anything unusual about the scene you are looking at.
- Ask yourself if anything is missing.
- Observe behavior at a low level of detail—watch what people touch and what they look at.
- Pay attention to the sequences and timing of events and actions.
- Don’t get in the way.
- Pay attention to trifles.”
-
- “Our models, personas, scenarios and stories should include:
-
-
- The primary goals that people have.
- The workflow of tasks people carry out.
- The mental models people build.
- The tools people use.
- The environments people work in.
- The terminology people use to describe what they do.”
“Fundamentally, all UX research answers one of two questions:
(a) “Who are our users and what are they trying to do?
(b) “Can people use the thing we’ve designed to solve their problem?”
You answer the first question with a field visit and you answer the second question with a usability test.
I think you get the idea. Just paying attention to these bullet points helps get to Outcomes and behavior changes that are needed to support Value Co-Creation.
David Socha then followed up with these thoughts and questions:
“Your notes point to the WHERE of user research, but do not extend to the need to use observe, don’t ask and show don’t tell in other aspects of the software development process. Such as in the daily demos, or when deciding if a work item is complete: after a developer makes a change, have the developer sit a customer / product owner / business analyst / etc. in front of the computer with the new system running (the system with the change) and ask that “customer” to give the system a try. Don’t tell them how the new thing works. Don’t walk them through it. Watch them using the new system. See where they do what you expect and, even more importantly, where they do something you had not expected. Ask them how well that works for them. Be curious. It’s not about whether the thing “works” or the bug is “fixed” – it is about whether the new system is the right new system. It may be that you fixed the bug, but the way the system now works actually isn’t what is needed … for whatever reason.
“In other words, I think that the observe+show mindset should be considered and embraced across many more aspects of the software development process. I don’t have a good sense or visualization of what that means yet. I still need to figure that out. My feeling is that it is something about creativity: anywhere there is a need for creativity, or perhaps any discussion about user experience (which can only be understood by experiencing it), one should try to avoid trying to use words to describe the thing. Something like that.”
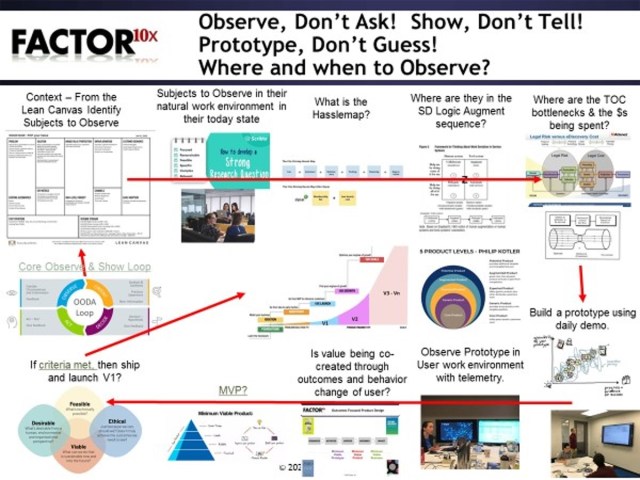
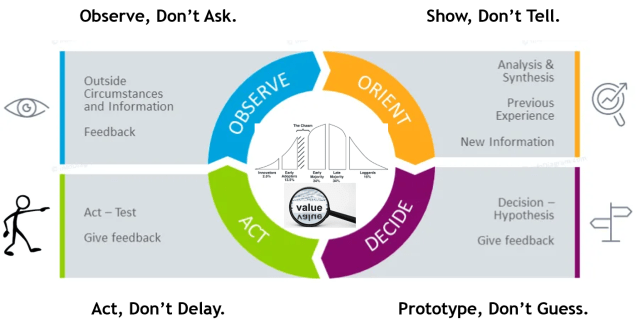
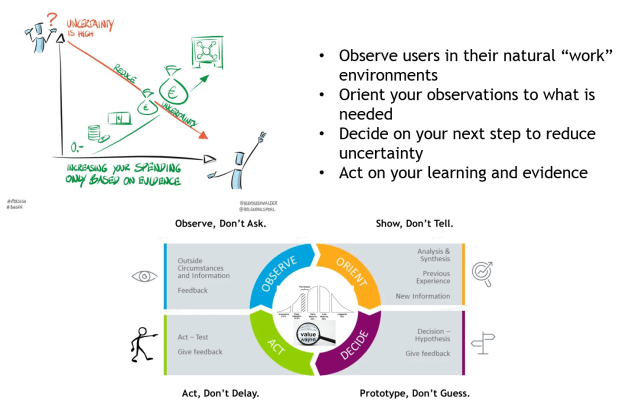
Observe, Don’t Ask. Show, Don’t Tell. Prototype, Don’t Guess. Act, Don’t Delay.
-
- Part 1 Observe, Don’t Ask. Show, Don’t Tell
- Part 2 Where does “Observe, Don’t Ask” show up in software product development?
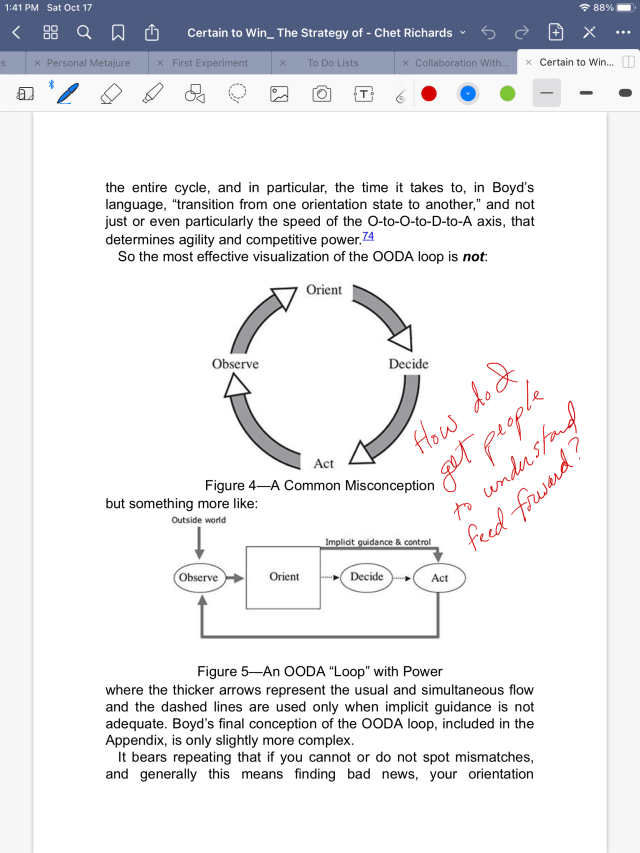
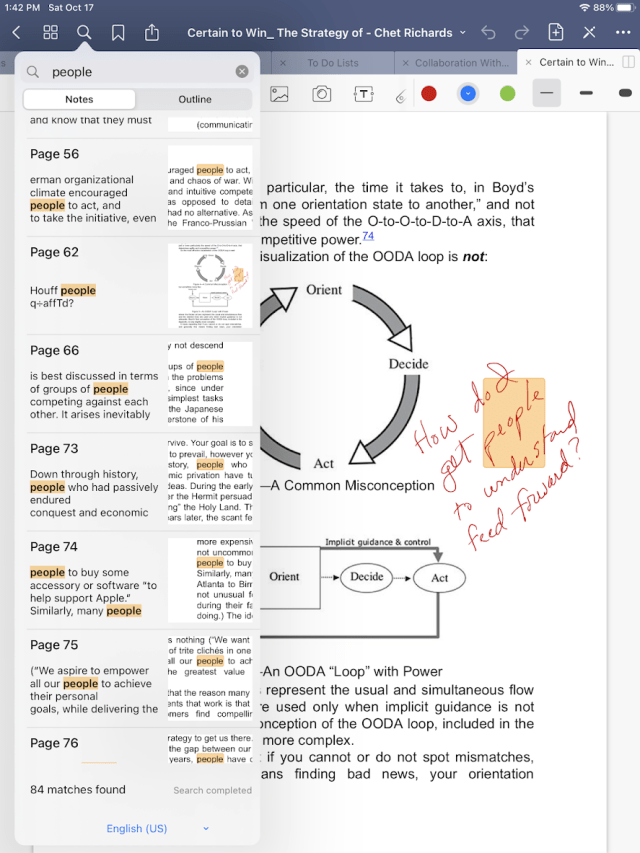
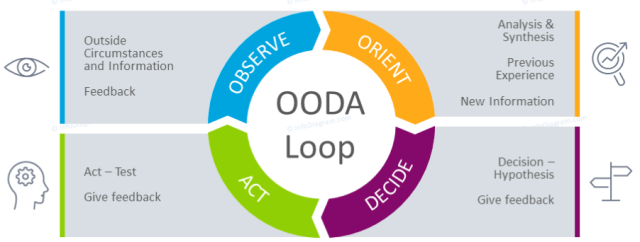
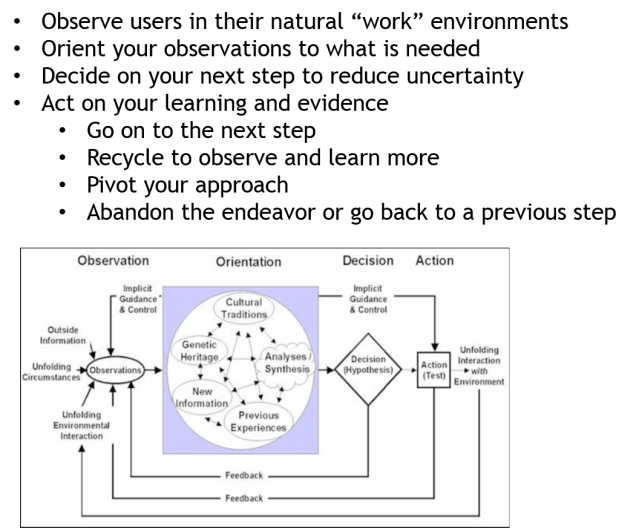
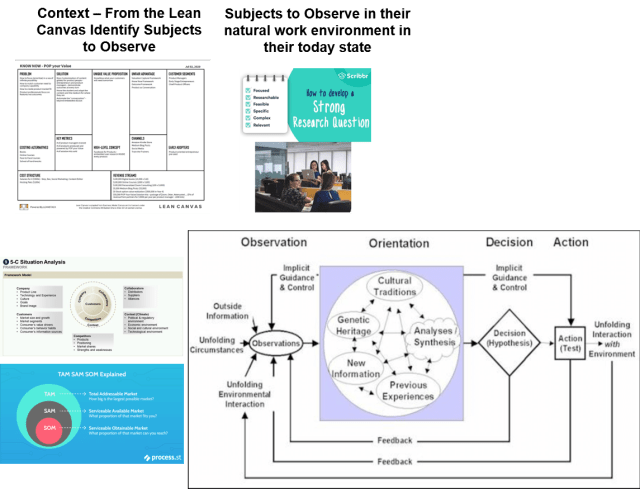
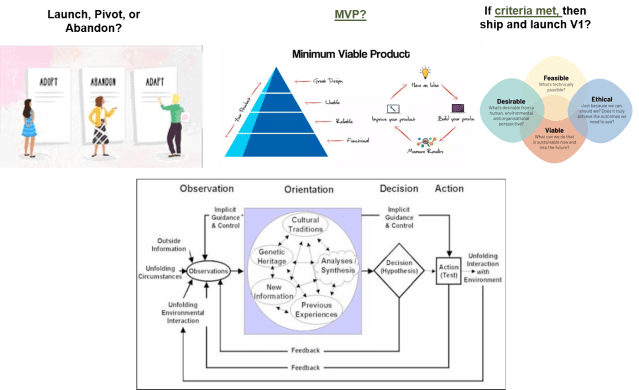
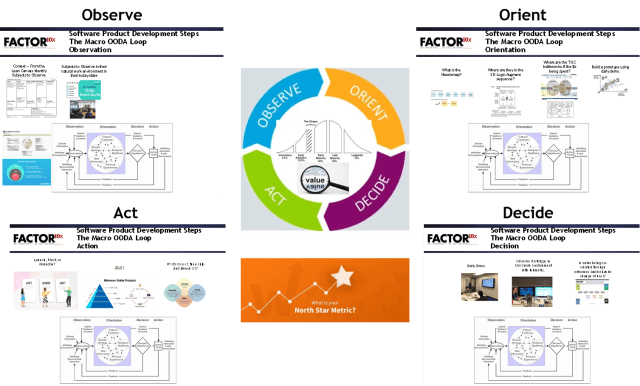
- Part 3 The OODA Loop
- Part 4 Orient, Evaluate and Prototype
- Part 5 Video Highlights for Show, Don’t Tell
- Part 6: Show the software, don’t try to describe it