Why are there so few visual analytics applications?

I wish I knew.

Robert Crawford asked “Why are there so few interactive visualization software application products in the legal space?  Attenex Patterns showed us the power of visual analytics to dramatically improve productivity in the legal market.  Yet, outside of Patterns and maybe Ravel’s legal applications there aren’t any other examples.  Why?”

Robert, I wish I knew.

What is Visual Analytics?

Sean McNee in his paper “A Primer on Visual Analytics” defines the discipline as:

“The discipline of visual analytics was formed to support analytic reasoning through the use of information visualizations as a form of external cognition [Thomas 2005]. For example, a research scientist could visualize citations across scientific publications to spot research trends. As such, visual analytics is related to several other disciplines, including information visualization, content analytics, and visual search. Before reviewing these connections, we first will formally define visual analytics.

Definition of Visual Analytics

“The formal definition of visual analytics is the use of interactive information representations to shape and control an analytic reasoning process.

“There are four parts to this definition:

1. Interactive information representations
2. The analytic reasoning process
3. Shaping the information flow in an analytic reasoning process
4. Controlling the analytic reasoning process

“We will discuss each of these in turn.”

McNee summarizes visual analytics in this diagram.

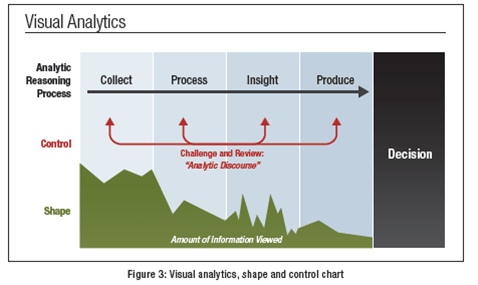
Visual Analytics Illustrated


Thoughts on Why There are so few Visual Analytics Software Products

My current beliefs for why there are so few application products that use visual analytics for unstructured information are the following:

    • Interactive visual analytic tools are not intuitive.  They require training.
      • Keyword search is intuitive and ubiquitous.  Visual searching is not.
      • Data visualizations are relatively intuitive and ubiquitous.  Unstructured information visualizations are not.
      • Visual analytics applications work best with users who are going to be working with the tool all day long like document reviewers in eDiscovery.
      • The axes of the visual search results are difficult to generate in ways that make sense to the user.
    • Visual analytic tools must be fast from start time to seeing results.
      • Keyword results from Boolean search engines are displayed in much less than a second.
        • The user never sees the behind the scenes work to index and analyze the content to make the searching appear very fast.
      • Visual search is often slow to respond due to either the local computing required or the transit time for network requests to the cloud.
    • Most people educated in Western society are not trained visually.  Most Western education focuses on words.
      • Of the five senses, only three are primarily used to convey information – visual, auditory, and kinesthetic (VAK).  Estimates are that the population is evenly divided into each category as their primary learning style.  Thus, only 1/3 of users on average are able to think and communicate naturally in a visual style.
      • Some professions attract people who are dominant in one of the learning styles.
        • The legal industry overwhelmingly attracts people who are good with words (the auditory learning style – spoken and written words).
        • The design profession primarily attracts people who are visual.
        • Sporting professions and the arts attract people who are kinesthetic.
    • Most software developers want to start with 3D or 4D (3D representations animated through time) visualizations.   Users have little idea how to navigate three dimensional space and constantly get lost.  3D visualizations do not work for visualizing unstructured information.  However, they look really cool.
      • A very tiny percentage of humans understand 3D projections onto 2D computer monitors.
      • Adam Pidlisecky and Rowan Cockett at 3Point Science confirmed the challenges for scientists and oil exploration professionals to understand 3D projections of geophysical data.
    • There are no first principles or prescriptive frameworks for designing visual analytics applications.
      • Tufte has done an excellent job of showing 100s examples of descriptive information design.  However, he has produced very little in prescriptive design principles.
      • Producing a visual analytics application is an iterative time consuming process of coming up with ideas, developing a prototype, having a metric, and testing the prototype to see if it improves the metric.  For the first four years of Attenex Patterns development, we iterated through more than 350 prototypes.  Only 1 in 5 prototypes increased our metric of “document decisions per hour.”  The rest of the prototypes were discarded.
    • A successful visual analytics product must understand its context of use, particularly what kinds of decisions the application must support.
    • A successful visual analytics product should strive for the Holy Grail of information visualization as described by Ramana Rao – “using visualization as a filtering tool, not just visualizing already filtered information.”
    • Potential customers (influencers, purchasers and users) make up stories and mock what they don’t understand.
      • We captured many of these “first impressions” as name the dots.

Attenex Patterns Iterative Prototyping in multiple dimensions – see Attenex Briefing Book

Can you name what you see?

Holy Grail of Information Visualization

Contexts of Visual Analytics – See Working with Interactions in Context

Over forty years of developing software products, I participated in the explosion of digital information.  I was frustrated that the only tools I had for searching were keyword in nature like the ubiquitous Google interface.  The dirty little secret of keyword searching is that you have to know the answer before you start.  Then, the results displayed as cryptic lists of lists were agony to scan through to find something close to what I am looking for.   I believed there was a better way.  At Attenex, we found a customer problem, eDiscovery for litigation, that would fund the development of some form of visual search tool.

As mentioned in “Attenex Patterns History – The Critical First Year,” we were inspired by the work of Jim Thomas and the visual analytics researchers at PNNL.  They showed us that the principles for “why visualization” espoused by Ilinsky and Steele in Designing Data Visualizations also applied to visualizing unstructured information and network graph structures like social networks:

“Before we dive into the categories, however, it may be useful to pause for a moment and be explicit about why visualization is a useful medium for examining, understanding, and transmitting information.

      • Visualization leverages the incredible capabilities and bandwidth of the visual system to move a huge amount of information into the brain very quickly.
      • Visualization takes advantage of our brains’ built-in “software” to identify patterns and communicate relationships and meaning.
      • Visualization can inspire new questions and further exploration.
      • Visualization helps identify sub-problems.
      • Visualization is really good for identifying trends and outliers, discovering or searching for interesting or specific data points in a larger field, etc.

“The key function of data visualization is to move information from point A to point B. In exploratory visualization, point A is the dataset and point B is the designer’s own mind. In explanatory visualization, point A is the mind of the designer, and point B is the mind of the reader. (More about these categories in Chapter 1.) In order to cross the gulf between points A and B and be successfully communicated, the information must be encoded for transmission. In this case, visual elements are the chosen transmission medium.

“For this reason, the designer’s purpose in designing a data visualization is to create a deliverable that will be well received and easily understood by the reader. All design choices and particular implementations must serve this purpose.”

Designing Data Visualizations . O’Reilly Media.

The authors go on to explain that when designing visualizations there is a trinity of informative versus persuasive versus visual art.

“It is useful to think of an effective explanatory data visualization as being supported by a three-legged stool consisting of the designer, the reader, and the data. Each of these “legs” exerts a force, or contributes a separate perspective, that must be taken into consideration for a visualization to be stable and successful. Chapter 2 will address the considerations of each of the three in much more detail, but we find it helpful to introduce the concept here.

“Each of the three legs of the stool has a unique relationship to the other two. While it is necessary to account for the needs and perspective of all three in each visualization project, the dominant relationship will ultimately determine which category of visualization is needed (see Figure below).
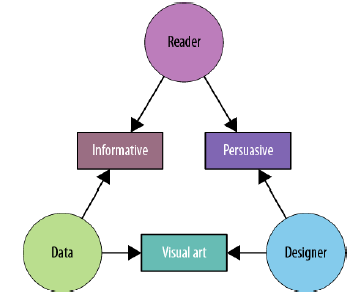
Informative

“An informative visualization primarily serves the relationship between the reader and the data. It aims for a neutral presentation of the facts in such a way that will educate the reader (though not necessarily persuade him). Informative visualizations are often associated with broad data sets, and seek to distill the content into a manageably consumable form. Ideally, they form the bulk of visualizations that the average person encounters on a day-to-day basis — whether that’s at work, in the newspaper, or on a service-provider’s website. The Burning Man Infographic (Figure 1-2) is an example of informative visualization.

Persuasive

“A persuasive visualization primarily serves the relationship between the designer and the reader. It is useful when the designer wishes to change the reader’s mind about something. It represents a very specific point of view, and advocates a change of opinion or action on the part of the reader. In this category of visualization, the data represented is specifically chosen for the purpose of supporting the designer’s point of view, and is presented carefully so as to convince the reader of same. See also: propaganda.

Visual Art

“The third category, visual art, primarily serves the relationship between the designer and the data. Visual art is unlike the previous two categories in that it often entails unidirectional encoding of information, meaning that the reader may not be able to decode the visual presentation to understand the underlying information.

“Whereas both informative and persuasive visualizations are meant to be easily decodable — bidirectional in their encoding — visual art merely translates the data into a visual form. The designer may intend only to condense it, translate it into a new medium, or make it beautiful; she may not intend for the reader to be able to extract anything from it other than enjoyment.”

Designing Data Visualizations . O’Reilly Media.

Creating a Personal Patterns

In the last year I was at Attenex, I carved out research time with Eric Robinson to work on a consumer and personal version of Attenex Patterns.  We knew we had to design for a different user than the eDiscovery lawyer that Attenex Patterns targeted.  These were some of the attributes we had to prioritize:

    • A user of personal Patterns would be a casual user.  They were likely to use the tool only a couple of times per day.
    • The information analyzed would be the user’s personal information.  This information would come from Microsoft Office 365 documents and emails. It was outside the scope to try and replace Google or paywall sources of information like Lexis Nexis.
    • The initial interface had to look and feel more normal.  It needed to be more intuitive.
    • The results had to show up as fast as a keyword search list of results.
    • The results had to provide obvious value beyond a Google like interface.

As we looked at the existing Attenex Patterns, we focused on reducing the complexity of the interface and figuring out ways to get instantaneous results.  We did not want to have to rewrite the “data and document wrangling” tool so we took as a design constraint working with existing personal keyword indexing and searching tools like X1 or dtSearch.  I described our early user research in “Transactive Content” and “Whiteboarding: Designing a Software Team.”

One of the lessons I learned at the Institute of Design in Chicago is that observing people in the wild (their actual work or living environment) is far better than trying to interview them. People make stuff up (mostly because they don’t want to appear stupid) when you interview them and most of the time they don’t really understand what they actually do (tacit knowledge). However, they are incredibly “articulate” when you can just observe them in their natural work habitat.

Marty Smith was working on his third draft of a licensing contract for a very large software company headquartered in our area. There was a lot of client discussion around a patent indemnity clause. He knew that he’d had to rework that clause for a couple of different clients in his previous ten years, but he couldn’t remember which clients nor which parties the contracts were for.

Marty’s primary tools are Microsoft Word and Outlook/Exchange. He organizes his file foldering systems (both on the hard drive and in Outlook Exchange) by client and then by year and then by the company name of who a contract was with. One giant hierarchical mess. He could have used a primitive Boolean search engine (but his law firm IT group wouldn’t allow such a thing – corporate security and all). Even if he’d had a search capability, by searching for “patent indemnity” he would have gotten 1000s of hits.

So I watched for thirty minutes as he walked the folder hierarchy, trying to use the client folder names and the contracting party names to jog his memory for one of the three or four contracts he’d modified in the past. He’d drill down through folder after folder; select a contract; scan through the contract in MS Word to see if there even was a patent indemnity clause; find nothing; and then go back to the folder hierarchy. No joy. So after thirty minutes, he gave up and went back to crafting a new clause.

I knew I was seeing something important here, but didn’t know quite what. So I asked a few business model questions.

Skip: How many times a week does this happen to you where you can’t find a clause you are looking for?

Marty: 3-4 times a week.

Skip: How many times a week does it happen to the other 20 IP attorneys in the firm?

Marty: Probably the same amount for each of us. And we never find what we are looking for so we have to draft from scratch. We try for a while, but never find anything.

My back of the envelope business calculation was the extra cost to clients of $500 per hour * 20 attorneys * 2 hours (search plus redrafting time) * 3 times per week = $60,000 per year. In this one law firm we had $60,000 per year of savings for what I was thinking we might price at $20 per seat. Oops, missed the value equation on this one.

I bounced down the stairs to share my findings with Eric. I described what I’d seen (unfortunately because Marty was doing client legal work I couldn’t use video ethnography to record and analyze his interactions). We realized that Gregory Bateson’s difference that would make a difference was if Marty could do clause level searching rather than try and guess at a couple of keywords that might be needed.

We put some straw designs together on the whiteboard and then I left Eric to do a prototype. After a few iterations, Eric worked his brilliance and came up with the following:

Attenuated Search

Attenuated Search

On the bottom left, the user selects a range of text to use as the search string. The selected text could be a couple of sentences, a paragraph or pages of text. The text is then copied into the search box (top of slide) and the text is treated as if it were a series of “OR” statements. Some 2381 documents were returned. That is clearly too many to look at. So either the slider bar for “Contains” is moved to the right or the “Proximity slider bar” is moved to the right until a more limited number of documents is identified (in the example 42 documents are returned). [NOTE: For those of you interested in the gory details of the search technique you can look at the Attenuated Search patent application.]

Once you get to a reasonable number of documents to look at you can display them with one of the standard visual analytics view of Attenex patterns (semantic network view, social network view, or timeline view).

Personal Patterns Document Mapper

Personal Patterns Document Mapper

Well, the fun was just starting. I went into my hustler persona and took the opportunity while we were interviewing the CIO at Bell South for a board position to demo the new prototype. I was unprepared for the result. He grabbed my laptop out of my hand and said “I’ll take it back with me.” Momentarily defaulting to my designer role, I objected “But you can’t; it’s just a prototype.” A tug of war with my poor laptop ensued as we both chuckled.

Quickly going back to my hustler persona to see if I could glean some more marketing data, I asked the CIO how much he’d pay if the prototype were indeed a product. He thought for a few seconds and said “I’d want this for the top 100 executives and managers (and our assistants) at Bell South, so I think an enterprise license of $300,000 per year would be appropriate.”

With just the addition of the “clause level” searching, we’d gone from no interest to a “got to have” application that senior managers were willing to pay quite a bit for.

The differences with this prototype versus our first set of prototypes were:

  • The ability to search on an arbitrary blob of text, in this case a whole contract clause.
    • The user didn’t have to guess what keyword might bring back what they were looking for.
  • The ability to interactively select how many results to look at instead of seeing the first 25 of millions of results like with Google.  The slider bar interface was intuitive and got to a manageable number of results interactively.
  • The ability to map in context visually how the selected results related to each other.

Users didn’t have to understand the complexity of a full visual analytics engine right at the start.  They could ease their way into it.  Most importantly they could immediately see how much time they would save searching during the course of a work day.

We had a good solution and we had a good feel for the potential market and revenue.  Unfortunately, Attenex was sold to FTI Consulting a few months later and Personal Patterns never saw the light of day.

If you are interested in learning more about the development of a visual analytics product like Attenex Patterns, the following documents are downloadable:

Posted in Attenex Patterns, Big Data, Content with Context, Design, eDiscovery, Human Centered Design, User Experience, Visual Analytics | 1 Comment

From My Chair: Vacation from History

“All civilizations face their fragilities. Many residents of the world’s wealthiest nations, particularly Americans, have felt fortunate to live through a period largely insulated from shocks and disruptions. This “vacation from history” enabled many to become accustomed to living at the efficient-but-fragile end of the robust-yet-fragile continuum. In a world temporarily devoid of consequences, the slow erosion and increasing inelasticity of the country’s political, financial, socioeconomic, and ecological systems scarcely seemed to matter. Now that a new, more volatile chapter has begun, those now-compromised systems have flipped from being engines of resilience to sources of fragility themselves.”

Zolli, Andrew. Resilience: Why Things Bounce Back (p. 261). Free Press.

As I sit in my favorite chair, awaiting the passing of the very reduced schedule of ferry sailings, I am haunted by how prescient the phrase “vacation from history” is to our present moment of the corona virus pandemic.


Occasional ferry passing

We are in Day 25 of our social distancing.

The ferry in normal times is almost like a slow moving metronome that goes by four times an hour.  I can hear it well before I see it from my chair.  Our long ago golden retriever used to bark at the ferry going by.  That was not a lot of fun at 2:30 am.  We mentioned this to our friend, Captain Bingham, who drove the ferries for over 20 years.  He laughed and said “Well, the barking always works because the ferry always goes away.”

But no barking can make the pandemic go away.  No barking can reunite us with our grand children.

I’ve spent a lot of time over the last couple of years rebuilding my personal resilience.  I’ve reached out to a wide range of friends, family, colleagues, and medical professionals to help me Build Resilience.  I’ve read a lot about resilience.

I love the following quote from Enlightened Aging:

“The path to healthy aging is not centered on the consumption of health care services. The path is instead centered on developing the ability to adapt to changing circumstances—the ability to bounce back from an illness, injury, loss, or any other setback. In a word, resilience. Don’t be fooled by the ads. You don’t procure resilience; you build it.

As I reflect while the occasional sun break light reflects off the Puget Sound, I remember the startling questions from one of my medical professionals “so what are you building resilience for?  What’s next?  What transformation is next for you as you build resilience?”

What transformation is next?

That is the $64 million question right now for this global pandemic.  What are we going to transition to?  How are we going to transform as we encounter our fragile existence because we were on a vacation from history?

Yet, this pandemic is wrapped in an even bigger threat of climate change.  I love the people that I’ve encountered in volunteering with the Citizens’ Climate Lobby (CCL).  While building the resilience of its members, they seek a bipartisan path to doing something today about climate change.  CCL wonderfully weaves a network of volunteers to make a difference now.  They follow many of the examples laid out in Zolli’s Resilience.  Zolli credits Valdis Krebs and June Holley for identifying the patterns of community resilience building in their research paper “Building Smart Communities through Network Weaving.”

What a wonderful term “network weaving.”

Krebs identifies five patterns in all effective networks:

  1. “Birds of a feather flock together: nodes link together because of common attributes, goals or governance.
  2. “At the same time diversity is important. Though clusters form around common attributes and goals, vibrant networks maintain connections to diverse nodes and clusters. A diversity of connections is required to maximize innovation in the network.
  3. “Robust networks have several paths between any two nodes. If several nodes or links are damaged or removed, other pathways exist for uninterrupted information flow between the remaining nodes.
  4. “Some nodes are more prominent than others – they are either hubs, brokers, or boundary spanners. They are critical to network health.
  5. “Most nodes in the network are connected by an indirect link in the network. A-B-C-D shows a direct link between A and B, but indirect links between A and C and A and D.  Yet, the average path length in the network tends to be short. There are very few long paths in the network that lead to delay and distortion of information flow and knowledge exchange.”

Krebs observes that “Network Weaving” follows four stages of knitting:

“A vibrant community network is generally built in 4 phases, each with it’s own distinct topology. Each phase builds a more adaptive and resilient network structure than the prior phase. Network mapping can be used to track your progress through these four stages.

1) Scattered Fragments
2) Single Hub-and-Spoke
3) Multi-Hub Small-World Network
4) Core/Periphery

As we transition from social distancing, we will need to transform ourselves, our communities, our nation, and our global relationships through our network weaving.  Through his many examples, Zolli offers many ways forward:

“Even our own thoughts play a role here, not only in our own resilience, but in others’ as well. The work of researchers like Richard Davidson, Elissa Epel, Clifford Saron, Amishi Jha, and others shows us paths to improving our own resilience through reflective practice and the discovery of greater meaning in our lives. And Gary Slutkin shows us how such habits of mind can be contagious, for good or ill. Tie these threads together, and you have the first links in a chain that connects your personal resilience to that of your social circle, your community, the place you work and live, and out across the world.  What you choose to believe, the mental practices you cultivate, and how you respond to disruption truly shape the whole. Resilience can radiate out from within.

“The journey toward resilience is the great moral quest of our age. It is the lens with which we must necessarily adjust our relationships to one another, to our communities and institutions, and to our planet. Even so, we must remember that there are no finish lines here and no silver bullets. Resilience is always, perhaps maddeningly, provisional, and its insistence toward holism, longer-term thinking, and less-than-peak efficiency represent real political challenges. Many efforts to achieve it will fail, and even a wildly successful effort to boost it will fade, as new forces of change are brought to bear on a system. Resilience must continuously be refreshed and recommitted to. Every effort at resilience buys us not certainty, but another day, another chance.

“Every day is Day One.”

Zolli, Andrew. Resilience: Why Things Bounce Back (pp. 275-276). Free Press. Kindle Edition.

Every day is Day One in transforming our vacation from history.

What networks are you weaving today?

Posted in Flipped Perspective, From My Chair, Wake Up! | Leave a comment

Explorations: Japanese Exclusion Memorial

Places evolve.  Life changes.  Lives change.  Attitudes broaden.  Or not.

In the midst of self-quarantine in the new normal, we take social distancing walks from our home most days.  Today’s walking journey brought us to the Bainbridge Island Japanese Exclusion Memorial.  While we stopped here several times when the memorial opened, I have not been back in more than five years.  We couldn’t have picked a better day with the sun out and the cherry trees in bloom.

Japanese Exclusion Memorial

From the National Park website, a brief history of the memorial:

Let it Not Happen Again

“After the attack on Pearl Harbor by Japanese forces on December 7, 1941, President Roosevelt signed Executive Order 9066. This order gave authority to the War Department to create zones from which Japanese Americans could be excluded. The first exclusion area designated was Bainbridge Island. On March 30, 1942, the Japanese Americans living on Bainbridge Island were gathered at the Eagledale Ferry Dock and sent to the incarceration camp in Manzanar, California before being transferred to Minidoka.

“Once World War II ended, about half of the Bainbridge Island Japanese Americans returned to the island to resume their lives, raise families, and pick up where they left off. But burning in their collective conscience was the Japanese phrase Nidoto Nai Yoni, which translates to “Let It Not Happen Again,” and they vowed to honor and recognize the members of their community who spent part of their lives in incarceration centers because of their heritage.”

Instead of the marks of new construction, the memorial now blends seamlessly in place with the beach side land sloping to Eagle Harbor.  The shrine feels like I stepped into a hillside memorial in Japan.

Honoring the indefensible

The entry carving is difficult to read without my minds eye seeing the many third and fourth generation islanders I pass by every day.

Let it Not Happen Again

As I slowly walk down the memorial hillside, I see the family names affected by the exclusion.  I see the floral remembrances hanging near family members.

Remembering and Honoring Ancestors

In the midst of the beauty of the day and the consummate craftsmanship and design, it is hard not to think about all of the atrocities occurring right now in our country with the suffering of the corona virus and immigrants seeking asylum at our southern border being excluded.

As I walk back to the entrance, I am stopped in my tracks by an apology plaque.

Apology

The words of our former Presidents bear echoing:

For here we admit a wrong.  Here we reaffirm our commitment as a nation to equal justice under the law. – Ronald Reagan, signing the Civil Liberties Act of 1988

I offer a sincere apology to you for the actions that unfairly denied Japanese Americans and their families fundamental liberties during World War II. – Bill Clinton Presidential Letter of Apology 1993.

As I stand with tears in my eyes, I try to imagine the current administration ever apologizing for the many exclusions and atrocities they commit every day.

Exclusion is happening again before our very eyes.

We have to stop.

Posted in Explorations, Travel, Wake Up! | 1 Comment

A Zoom Wake in the Age of a Pandemic

Nick Nussbaum died earlier this week.  He died of the corona virus due to underlying health conditions.

Nick died without family, friends or colleagues present.  Only the brave medical professionals were in attendance.

Nick Nussbaum

We found out about his passing days after his death.  None of us knew he was even in the hospital.

Bill Knight, who worked with and managed Nick at several companies, arranged a Zoom online video wake for several of Nick’s co-workers.

Zoom wake for Nick Nussbaum

While Nick was not a personal friend, we were colleagues at several different companies ranging from Aldus/Adobe to Attenex/FTI Consulting.

Each of us brought our own favorite beverage and stories about Nick to the wake.  After each story, we would toast Nick.

Nick was an MIT graduate in Computer Science.  He was beyond passionate about technology and seemingly knew it all.  He loved to argue which was a blessing and a curse.  As colleagues, we each had to adapt to Nick.

He was a world class software engineer and an expert at text rendering in print and in graphical user interfaces.  His code is in many commercially successful products from Microsoft, Aldus, Adobe, Visio, and Tableau to name only a few of the software companies he contributed to.

Nick holds several patents in the realm of text processing.  The “Method and apparatus for concealing character modifications made for text composition purposes” is just one of his contributions:

“Disclosed is a text justification program (20) that runs on a computer (22) in accordance with the invention. The text justification program provides an improved method for justifying text by introducing random character modifications throughout the text so that characters modified for justification purposes do not stand out.”

Nick was a frequent contributor to online forums that had anything to do with text processing and typography:

Space is an antique convention …

As my former colleagues shared stories of Nick, I learned more about his capabilities than I had in my 15 years of interacting with him.

The shared stories fell into two categories:

    • How difficult it was to work and collaborate with Nick
    • What a big heart and graciousness Nick had outside of work in social situations

I shared my first interaction with Nick when we went to a Pagemaker customer dinner at The Brooklyn Grill while early in my tenure at Aldus.  I’d asked for several Pagemaker software engineers to attend as this customer was technical and wanted to learn more about how we developed the product.  This was my first dinner with these fine folk and I was not aware that there was a Pagemaker dinner ritual.  For the first forty minutes of any dinner, Nick and the software engineers had to critique the restaurant’s menu – not for content, but for its page layout.

I learned more about kerning and leading and font choices and typography than I ever wanted to know.  I kept interrupting to at least get some drinks and appetizers ordered.  No such luck.  The customer loved the experience.  Nick was in his element illustrating his wide and deep knowledge about everything having to do with text.  I was mesmerized by the challenges of doing typography in print versus doing typography online in graphical user interfaces.

The pre-dinner session ended with the tradition of guessing which page layout software application was used to create The Brooklyn’s menu AND how each engineer knew.  As it turned out, Nick always won these bets.

While we would prefer to have the wake face to face in one of the local bars, Zoom allowed us to honor Nick sooner rather than later.

The ultimate tribute to Nick’s big heart and graciousness towards others was finding out that Nick refused to be put on a ventilator at the hospital.  He knew his time on earth was at an end and he asked the ICU staff to save the ventilator for someone with a higher probability of surviving.

Bill closed the session with an Egyptian saying he remembered from somewhere in the past:

“The Egyptians believed that you die twice. Once when you take your final breath, and then again the last time someone says your name. They believe your spirit lives on as long as people kept remembering you.”

Rest in peace, Nick Nussbaum.


Posted in From My Chair, Health Care, Lifelet | 6 Comments

A Product Produces Outcomes

What is an outcome?

“So let’s start by defining the word in our context: an outcome is a change in human behavior that drives business results. Outcomes have nothing to do with making stuff—though they sometimes are created by making the right stuff. Instead, outcomes are the changes in customer, user, employee behavior that lead to good things for your company, your organization, or whomever is the focus of your work.”

Seiden, Joshua. Outcomes Over Output: Why customer behavior is the key metric for business success

For my entire career in software product development (software engineering and product management), I’ve been frustrated at product managers with their Excel spread sheets of 100s to 1000s of new features to be prioritized at least once a month.  At my worst, I would yell and scream and throw things.  I even fired a few product managers when they wouldn’t change their behavior.

Beyond the frustration with the feature list, I was bewildered as to why it would take us several version releases to come close to what users needed versus what they say they wanted.  My lowest point came when one of our DEC corporate seagulls darkened my door during the development of ALL-IN-1.

Corporate Seagull

This corporate seagull was from the user experience usability group (today we call them UX).  He exclaimed “I’m sorry but we can’t let you ship ALL-IN-1 V3 because it doesn’t meet our usability standards?”  “Who are you again?” I asked as politely as I could muster. He explained who he was and the problems they saw with our product.

“I tell you what.  We’ve just spent $10 million dollars and 18 months developing this version.  We are going to ship it next week as planned.  However, I will be happy to have you start working with us after we ship, so that we can fix these problems in the next release.”

With a snide smile, he responded “Oh no, we don’t work that way.  You have to build it first and then we test it and then we tell you that it sucks.”

I threw my coffee cup at him and bellowed for him never to darken my door again.  Fortunately, I missed.

I knew there had to be a better way for all of these problems, but I didn’t have time to look for them.  I had software to build and ship.

When I was first exposed to the Institute of Design (ID) at Illinois Tech through Patrick Whitney and Larry Keeley in 1992, I found the better way I didn’t know I was searching for – human centered design (HCD).

I immersed myself in HCD by studying and teaching at ID and found the combination of user research (particularly through video ethnography) combined with the synthesis aspect of strategic design planning to be the holy grail I was looking for.  But I couldn’t explain it to my product managers and development managers.  Nor could I hire ID grads to help with the problem because I couldn’t teach them the business, operations, and the nature of the medium of software development fast enough.  I was frustrated beyond belief.

Then as Chief Product Officer at FTI Consulting for the eDiscovery products, I discovered the power of outcomes versus outputs (feature lists).  The two books that catalyzed the focus on Outcomes were:

Badass focuses on how to DEVELOP the users, not just providing a tool.

I’m awesome!

“It’s not about our product, our company, our brand.

“It’s not about how the user feels about us.

“It’s about how the user feels about himself, in the context of whatever it is our product, service, cause helps him do and be.

But people don’t actually talk like that.  Nobody says “I’m awesome” because of a product.  They say, “I love this” or “This app is amazing.

“It’s not about the actual words they say, but about the feelings that inspired them to say it.  “I’m awesome because of this” is the feeling behind their actual words, “This thing is awesome.”

“Instead of looking for common attribute across successful products, we must look for common attributes across successful users of those products.”

Creating better users

What a concept.  Don’t just make your product better.  Figure out how to make your users better.  With a little editing I shared the following slide with my product managers.  I urged them to go beyond making a better Ringtail eDiscovery product and figure out ways we could make a better “resolver of disputes.”

Creating better users in their context

However, there is an immediate brick wall in the way of making this mental switch.  In order to make a better user, I have to understand their context and business AND their customers.  What do my customer’s customers need?

As I was pondering how to teach my product managers and development managers the importance of outcomes, I found Product Roadmaps ReLaunched.  This book summarized the key to a good product roadmap – switch from talking about features to committing to outcomes.

“When a customer (or a CEO, or really any stakeholder) asks about whether a particular feature or design or other detail will be part of the solution, rather than answer the question, experienced product people have learned to turn it around. They ask “Why?” Why is that feature important to you? What is it about that date? The smartest product people are trying to understand what problem that stakeholder is trying to solve. This helps them understand their customers’ needs better, of course, but it also raises the level of discussion.

“With an understanding of the real goal, a product person can then ask the customer, “If I commit to solving this problem for you the best way I can, then do we have a deal?” Or, as Drift’s David Cancel suggests, “Rather than try to predict the future, why don’t I invite you into our process? If you are a key strategic customer, then when we get close to a possible solution for the thing that is of concern to you, we’ll bring you into a design review and let you give us feedback about whether it meets your needs.”

“When customers and other stakeholders make these demands, it’s because they don’t know how else to influence product direction.”

Lombardo, C. Todd; McCarthy, Bruce; Ryan, Evan; Connors, Michael. Product Roadmaps Relaunched: How to Set Direction while Embracing Uncertainty.  O’Reilly Media.

Commit to Outcomes

Yet I still had the problem of training product managers to shift their thinking to outcomes versus features.

“Why not just make an endless list of features and ask our teams to work on that list—forever? In fact, a lot of contemporary project management turns out to work exactly this way. The problem with this approach is that features can be finished and delivered and “work perfectly” but still not deliver any value. Think about all those website pop ups that try to get you to subscribe to a company’s mailing list. Do they work? Technically, they function as specified. But do they deliver value? Turns out that on the whole, they don’t—people simply get annoyed and just abandon the web site instead.

“Our world is full of “features” like this that work as specified and yet deliver no value—or worse, create problems we never intended. If you’ve ever used a microwave oven you’ve experienced this problem: how many of those buttons do you use in real life?

“So if features don’t automatically create value, then it follows that we shouldn’t use them as the center of our planning process. In fact, we want to use a planning process that makes it possible to make as little stuff as possible and still achieve the outcome we seek. How do we do that? That is the question this book answers: we can instead use the idea of outcomes. Outcomes, or the human behaviors that drive business results, are what happen when you deliver the right features. Ideally, they happen when you’ve delivered as few features as possible.

Seiden, Joshua. Outcomes Over Output: Why customer behavior is the key metric for business success . Sense & Respond Press.

An example is in order from the social impact sector with their Program Logic Model:

“Imagine that you work for a charitable organization and you’ve been asked to build a well in a small village that lacks modern plumbing. You’ve been given funding by a foundation that wants to increase the standard of living in this village. They have observed that villagers spend a large amount of time every day walking to the river to carry water. The foundation believes that if the villagers had a well in the center of the village, they wouldn’t have to carry water such long distances anymore, and they could use their time for other activities—ones that would allow them to improve their standard of living.

“In the social impact sector it’s common to use a model called the Program Logic Model to plan work like this and evaluate the results. In the diagram below you can see the building blocks of that model:

“For our well project, the model might be something like this: we plan our resources (the people, materials, money, and other things we need), we undertake a set of activities (traveling to the village, acquiring and transporting our materials, building a well). If all of this goes according to plan, we create the output—the well. If the well works as planned, we achieve our outcome—people in the village spend less time carrying water. That in turn, becomes an important contributor to the impact we seek: a higher standard of living in the village.

“Notice that the outcome—people spend less time carrying water—is a change in behavior that creates positive results.

“Why do we need all these levels in our model? Although our ultimate target is to improve the standard of living in the village, that target is actually a result of many factors. To see if our work is actually making a difference, we need checkpoints that are smaller, measurable, and more closely connected to the work that we’re doing. That’s where outcomes are important. By setting our outcome as “villagers spend less time carrying water” we have an easier time assessing the quality of our work.

Outcomes for Managers and Executives

“Setting goals as outcomes sounds simple, but it can be hard to do in practice. One thing that makes it hard is that we often set goals that are too high level—we tell a team to make our business more profitable, or to reduce risk, or something else that’s really a factor of many variables. These impact-level targets are too complex to be useful to our teams. Instead, we need to ask our teams to work on outcomes—the smaller, more manageable targets that, taken together, will create the impact we want. We do this by asking them to focus on changing customer behavior in a way that drives business results.

“We want our customers to log onto our site more often, or put an extra item in their shopping cart, or share an interesting article with a friend, or upload a picture, or complete a task in less time. What do all of these things have in common? They’re all measures of customer behavior. They might be small changes in a big system, but they are specific, and they allow our teams the flexibility to figure out the most efficient way to solve the problem, to deliver the behavior change that we seek, and to make a meaningful contribution to the impacts (revenue, profitability) that our executive leaders care about.

“So let’s review: you can manage a team by telling them what to make: that’s called managing outputs. It’s a problem because features don’t always deliver value. You can manage a team by asking them to target some high-level value, like growing revenue. That’s called managing impact. It’s a problem because it’s not specific enough.

“What you want is to manage with outcomes: ask teams to create a specific customer behavior that drives business results. That allows them to find the right solution, and keeps them focused on delivering value.

Seiden, Joshua. Outcomes Over Output: Why customer behavior is the key metric for business success . Sense & Respond Press. Kindle Edition.

When I am at my innovator best, I remember to pay attention to outcomes.  When I get stuck, I go find a representative user to observe for a couple of hours.  Where possible I bring a camera to augment my observation with video ethnography.  In a blog post on Transactive Content, I shared a story of observing for outcomes:

Marty Smith was a senior partner and transactional attorney, formerly at K&L Gates.  He took on the most important and complex contracting tasks for companies like Microsoft.  As he negotiates clause by clause in these complex contracts he often has to go find similar clauses in contracts that he has constructed and then modified over the past 25 years.  During a user research session on a “live” contract negotiation, we watched him spend over 30 minutes trying to find examples of ways in which he had modified a particular clause.  He knew that he had done it about 30 times in the past, but couldn’t remember for which clients and which contracts.  He finally gave up and had to craft his changes from scratch without the benefit of his previous work.  With the Quicksilver Attenuated Search capability he would have found the documents which contain the clause within 30 seconds.  The cost to the client from lost productivity >$500.  The cost from not doing his best work – unknown.  This happens several times a week for each transactional attorney we observed.

The Quicksilver prototype was patented and became a part of the Ringtail eDiscovery (now Nuix Discover) product and changed the searching behaviors of hundreds of attorneys.

Armed with these wonderful resources, particularly Outcomes Over Outputs, I required my product managers to start doing their roadmaps and engineering requirements in terms of outputs.  They all nodded and went off to work on outcomes and nothing useful came back.  What was so obvious to me, wasn’t so obvious to them.  I even tried using an outcomes orientation as the backbone of a product planning session for a contract lifecycle management software company that included most of the senior executives.  I knew I was in trouble when even the executives, including the Chief Product Officer, could not develop even a single outcome.  Everything that came back in the working session was a feature.  There was no linkage between any feature and an outcome or a business impact result.

Why is this so hard?

Often, when I am in doubt I go back and re-read something from Russ Ackoff.  When I am really confused I re-read his Bell Labs story of how he “discovered” his Idealized Design technique.

“Doesn’t it strike you as odd,” the Bell Labs director said, “that the three most important contributions this laboratory has ever made to telephonic communications were made before any of you were born? What have you been doing?” he asked. “I’ll tell you,” he said. “You have been improving the parts of the system taken separately, but you have not significantly improved the system as a whole. The deficiency,” he said, “is not yours but mine. We’ve had the wrong research-and-development strategy. We have been focusing on improving parts of the system rather than focusing on the system as a whole. As a result, we have been improving the parts but not the whole. We have got to restart by focusing on designing the whole and then designing parts that fit it rather than vice versa. Therefore, gentlemen, we are going to begin by designing the system with which we would replace the existing system right now if we were free to replace it with whatever system we wanted, subject to only two not-very-restrictive constraints.”

Ackoff, Russell L.; Magidson, Jason; Addison, Herbert J.. Idealized Design: How to Dissolve Tomorrow’s Crisis…Today . Pearson Education (US).

Ackoff notes that most product developers focus on the deficiencies of an existing system.  My product owners were focusing on the deficiencies of the existing system (at that point on its tenth major version).  They were not looking at our customer’s system and the behaviors of the users.  They were not looking at the business models of our customers.  They could not “see” the behaviors that needed changing and the business results for our customers that could be enhanced.

They did not know how to see.  They did not know how to observe.  They did not know how to correlate what they were observing to meaningful business results and value.

I couldn’t just proclaim that we were going to move to an outcomes orientation, I had to provide relevant education in human centered design techniques AND business modelling in the Alexander Osterwalder and Ash Maurya and Steve Blank sense.  Unfortunately, this knowledge would require several years and several masters degrees in a formal academic setting like the University of Washington or the Institute of Design at Illinois Tech.

My first attempt at teaching a subset of these techniques was in a graduate school class on “Designing a Human Centered Venture.”  I was delighted that the ten week class produced a working Air Quality Monitor.  Within the ten week class they were able to produce a “product” that they could use to test whether users would change their behavior.  However, the business model and product marketing efforts were relatively weak in comparison.

Personal Air Quality Monitor

Now that I have the time while self-quarantined due to Covid-19, it is time to take Jeanine Blackwell up on her offer to help me build some online courses.  One of the first courses will be about outcomes versus features.

What a great outcome if I could help product managers shift from infinite feature lists to outcome commitments in order to increase the business value to their customers.

A product produces outcomes.

Posted in Idealized Design, Outcome, Product, Software Development, Transactive Content | Leave a comment

A Product is a Conversation

I am in conversation with hundreds of products a day.  From my Fitbit to my iPhone/iPad to my desktop computer to my Honda CRV, I converse with the products in my life.  Alexa Show takes that even farther by letting me interact by voice.

Conversing with Products

Yet, none of these products KNOW ME or converse with me in the context of knowing me.  Many of these products even have cameras that can “see” me.  As Larry Keeley observed “the average automated urinal knows how to act when I am present much better than does any computer device.”  The urinal knows when I am present, knows when I leave, and knows how to act when I leave – by flushing any evidence of my presence.

As I shared these thoughts with my colleague, Arjun Chakravarti, he reminded me that the “product is a conversation” needs to use something like the Zaltman metaphor elicitation technique.  Professors at Harvard introduce the technique at the Mind of the Market Laboratory website:

“Managers have been saying for years that their organizations should be consumer-oriented and market-focused. Of course, expressing a goal and fulfilling it are not the same thing. Achieving this goal requires basing marketing decisions on a thorough understanding of current and potential consumers. Gaining this knowledge is not easy, but it is essential to gaining and sustaining competitive advantage.

“Business executives deal with a variety of interesting and challenging issues in managing their products and brands, including the following:

      • What basic value or equity does my product or firm have in the consumer’s eyes?
      • How can I build or reinforce this value?
      • How can I establish a loyalty relationship with my consumers?
      • How can I anticipate and understand consumer needs, especially those they find difficult to express?
      • How do the habits of mind among my managers influence their thinking about consumer issues?
      • What am I really saying about my product or company in my advertising and by my promotions?
      • How can I establish a consumer focus as an integral part of my corporate culture?

“Answering such challenging questions requires an in-depth, fundamental understanding of how current and potential consumers think and feel about a product.”

“Yes, exactly,” I respond.  “But this Zaltman thing needs to be IN THE PRODUCT!”

The Honda CRV is a little bit better then a urinal, as it knows by my physical key that I am getting in the driver’s seat and adjusts the seat to my needs.  However, I found out by surprise that the CRV sneakily knows me through a camera hidden somewhere around the driver’s seat.  If I happen to yawn (which I did as we entered Moab, Utah after a long day’s drive), the driver side display changes and warning sounds start going off.  The car commands me to stop for some coffee.

Honda CRV Attention Monitor

These product conversations are mostly mechanical and limited.  With the exception of devices like Alexa, the interactions and conversations aren’t usually saved or analyzed in ways to add value to and evolve the product.

If you search for phrases like “product as a conversation” there are lots of results returned but they are mostly about a product manager needing to be in conversation with their customers.  An early variant of this recommendation was in the Cluetrain Manifesto where they described the “market as a conversation.”

What if a product could really converse with me?  What if a product remembered me and knew that I was present like I described in “My Story Teller Knows Me?”  What if a product could understand my needs and suggest things to me without my asking?  What if a product could enter into a value exchange relationship with me?

A long time colleague, Rachi Messing, reached out to me a week ago to see how I was doing in the Age of the V.  Rachi lives in Israel and often visits when he comes to Seattle.  On a recent visit, he kept pulling out his cell phone and checking it every few minutes.  Instead of giving him a hard time for his distractions, I asked what he was doing.  “Oh, you might be interested in this.  It is a real time rocket alert app that lets us know if the terrorists have sent a rocket toward my home.  I am just checking to make sure that it was a short distance rocket and not one that could reach my home while my wife and family are there.”

On our most recent call, he shared what Israeli intelligence was doing to help combat the spread of the corona virus.

“Corona virus phone tracking doesn’t just tell governments more or less where their citizens are, but can also show the phone owners’ “micro-environment” and provide a treasure trove of information about their physical surroundings, a systems engineer behind key technology being used in the battle against the spread of coronavirus has revealed.

“The data we analyze is about the micro-environment a person is in,” said Shaashua, vice president for product at Neura, explaining that the average phone has 14 sensors that provide information about motion, acceleration, light, and other aspects of a person’s physical surroundings.”

I was dumbfounded at how much information was kept and transmitted from our cell phones and then how they can be analyzed for micro location analysis.  Using the micro location analysis they can determine whether you’ve come in contact with a diagnosed corona virus carrier and then suggest/demand that you go into self-quarantine.  Rachi was asking me how I thought that kind of privacy invasion would go over in the US.

I laughed and shared “the U.S. NSA already has all of that information and Google most likely does.  The only question is whether they have enough computing power to analyze movements of 300 million people in real time.”  Later, I found an article that shared the kind of analyses that are being published:

“If you have a smartphone, you’re probably contributing to a massive coronavirus surveillance system.

“And it’s revealing where Americans have — and haven’t — been practicing social distancing.

“On Tuesday, a company called Unacast that collects and analyzes phone GPS location data launched a “Social Distancing Scoreboard” that grades, county by county, which residents are changing behavior at the urging of health officials. It uses the reduction in the total distance we travel as a rough index for whether we’re staying put at home.”

Analytics for Social Distancing

The Tectonix GEO team went farther and analyzed the spread of people who ignored social distancing while in Florida on spring break and where those students traveled to afterwards.

Spring Breakers spreading corona virus

As I kept searching, I came across an article that confirmed something that I had hoped/suspected existed – the ability to track health symptoms from a wearable watch.

“But that doesn’t mean wearable devices are powerless to help in the fight against COVID-19. Just like your smartwatch’s heart-rate monitor can alert you to possible warning signs of atrial fibrillation or sleep apnea, it can also spot warning signs that might signal your body is fighting a flu-like infection—if you know where to look.

“Cardiogram co-founder Johnson Hsieh discovered the correlation after tracking his BPM during a bout with the seasonal flu in January. He noticed that his normal sleeping heart rate was about 10 beats per minute higher while his body was fighting the virus and returned to normal as his sickness subsided. The higher BPM was also evident during other parts of the day, but sleep is where it’s easier to spot.

“It’s due to vasodilation, which is a fancy medical term for the expansion of the blood vessels during inflammation. As blood vessels expand, signals are sent to your brain to increase your heart rate and provide additional blood supply to inflamed regions.

“A pretty clear signal in your heart rate when you have symptoms that would otherwise be measured exclusively by a thermometer,” said Harish Kilaru, head of product at Cardiogram. “When your body is fighting an infection, both your sleeping BPM and your resting BPM are higher.”

Forgetting the “big brother” and privacy issues with these stories, they illustrate positive aspects of our devices being in conversation with each other at the data level.  Even at this level, the collection of products provide valuable individual and humanity survival information – in real time.

The components of this array of products are fairly standard in interesting consumer and enterprise applications.  Take a relatively simple Fitbit network of devices.

    • The Fitbit Alta HR wristband
    • The Fitbit Aria 2 scale
    • The Fitbit app on my iPhone
      • Utilizing Google maps for geolocation information on my walks
    • My Fitbit account in the cloud
    • The analytics in the Fitbit cloud to analyze sleep cycles and resting heart rate and maps of my walks
    • The sharing of accounts in the cloud for family members to track
    • The weekly scoreboard of my Fitbit tracking community

Through a combination of bluetooth connections between our Fitbit wristbands and our cell phones, cellular data transfer while we are mobile, and wireless data transfer when we are home, these devices share the data of my exercise life with me and with my family members.  Being a group of Type A personalities, a natural competition to outdo the others happens.

Yet, the conversations that are held within this hardware software computing/communicating network are data conversations.  There is no conversation with me.  The conversations that our family has around our exercising are completely outside of the Fitbit data sharing environment.  Fitbit is in conversation with my quantified self but not the cognitive me.

What if I could add to the data conversations?  What if I could have a conversation with Fitbit products that goes beyond a data exchange?  And also goes beyond the features I might like to what are my higher order goals and how Fitbit is fitting into my goal pursuit (that Zaltman thing again)?  What if I could have a real value exchange relationship with my Fitbit data network?

As I related these thoughts to Rachi, he mentioned an app that a former colleague is developing to help stroke patients and their physical therapists improve the patient’s walking gait after a stroke.  I almost jumped through the Skype connection “how do I get a hold of that app?  Working on my gait is one of the big challenges I’ve had with my physical therapist?”

So I reached out to One Step to see if I might get an alpha version of the iPhone app.  I was “approved” for the app.  The product manager sent this reply:

“I do think OneStep could be of help to you, certainly.  The OneStep app works like this: we are developing your phone into a mobile gait lab! This means you can simply record walks on your phone in the app, and we will analyze your gait and specifics about your walk. If you record one walk per day, even inside your home, or outside on the trails, every two weeks of recording we will send you a full report about your walk. And if you want, we can send it to your therapist as well! (Are you still in touch?). That way they can stay updated with your progress. If you don’t want us to send to your therapist, we can also have one of our own therapists look at the report and give their thoughts.
 
“You can also use it independently of any PT – and keep track of your healthy steps and get your gait reports directly on your phone.
 
“The app is still in development, so we will gladly appreciate your feedback throughout the next few weeks or months that you use it. It’s great to have you on board! “

The good news is that I have an app that can help with my physical well being AND I am in conversation with the product manager.  Even in its early stage of development the app will provide value.  And there is an exchange of value.  But this conversation is labor intensive on both my part and the product manager’s part.

This introductory email conversation raised several more questions:

    • What is the product?
      • Is it a product or a service?
      • Can I really make use of this product on my own or do I have to work with my physical therapist?
    • Who is the user?
      • Me?
      • The therapist?
      • The insurance companies?
    • Who pays for this?
    • Who receives what value?
      • Is there fair reciprocity in the exchange of value?
    • Why can’t the conversation be built into the product?

Another set of former colleagues built a user research product called dscout to provide In-Context insights in near real time.   I remember being astounded when they shared one of their early successes.  They talked about a popular retailer with over 70,000 members in their loyalty club.  The retailer was frustrated with how long it took and how expensive it was to field a research project to answer questions about how to improve their in store merchandising exhibits.  So the dscout team demonstrated in real time how to field a research study during their two hour meeting.  First they identified with the retailer’s loyalty app dashboard which members were in one of their stores that very moment.  Then they texted those members by cell phone to ask them to go to the men’s section of the store and take a photo of the shoe display.  Then they asked the loyalty members a couple of questions while they were at the shoe display.

Within minutes the retailer had qualitative and quantitative data to answer a shoe merchandising question they had debated for weeks.

Over the years dscout has added video responses to their survey questions along with automated speech to text and text analytics of the user’s responses.  The time and cost to field user research studies AND analyze the results AND make decisions is dramatically reduced.

What if user research capabilities were an integral part of every product?

The product then becomes a channel for value adding conversations.

A product is a conversation.

Posted in Ask and Tell, Biodynamic, Design, Flipped Perspective, Learning, Product, Transactive Content, User Experience | Leave a comment

Lifelet: Footsteps

Google captured that I walked on water yesterday.

Walking on water

OK, so the tide was out really far and the Blakely Harbor sandbar was exposed.

Walking to a different perspective

As I returned to shore, there were my footprints.

Footsteps

“Footsteps” was an answer to a daily riddle we shared with our six year old granddaughter:

“The more you take, the more you leave behind.”

And then sometimes, the mud monster reaches down and just grabs your foot as it tries to leave behind a footprint:

Walking IN THE mud

The tidal mud flat got the last laugh on this walking on water dude.

On Day 17 of Groundhog day in the Age of V, where are our collective footsteps going?

“As a single footstep will not make a path on the earth, so a single thought will not make a pathway in the mind. To make a deep physical path, we walk again and again. To make a deep mental path, we must think over and over the kind of thoughts we wish to dominate our lives.”

Henry David Thoreau

What are the footstep thoughts that need to pave my way today?

Family, medical professionals, first responders, colleagues, essential workers at essential businesses, and our fellow global citizens are at the forefront of my thoughts today.  But what about tomorrow?  Are we learning enough to make the changes for our future footsteps and thoughts?

“You never let a serious crisis go to waste. And what I mean by that it’s an opportunity to do things you think you could not do before.”

Rahm Emanual

I search my digital mess to find the inspiring words that once guided DuPont:

“Our principles are sacred. We will respect nature and living things, work safely, be gracious to one another and our partners, and each day we will leave for home with consciences clear and spirits soaring.”

I come across the guiding words of Johnson & Johnson’s credo reprinted in Paul Collier’s The Future of Capitalism: Facing the New Anxieties:

“We believe that our first responsibility is to the people who use our products.”

I pray that the SCIENTISTS who are searching for vaccines and cures to COVID-19 embody the inspiring words of DuPont and J&J.

These are footsteps worth following.

Posted in Lifelet, Patterns | Leave a comment

Lifelet: Existential questions in the Age of V

In our long ago Duke University dorm discussions, another philosophy exam question was thrown out.  A professor in the final exam asked just one question “Why?”  There were only two acceptable answers to get an “A”:

    • Why not?
    • Because

Fueled by beer, we enjoyed an evening of sophomoric debate.

Later in life I enjoyed the mentoring of Russ Ackoff.  His graduate students introduced me to their “Ackoffian existential crisis.”  Russ’s goal in life was to answer each question with a better question.

For some reason I love the word existential – “concerned with existence, especially human existence as viewed in the theories of existentialism.”  Wikipedia sheds light on existentialism:

“While the predominant value of existentialist thought is commonly acknowledged to be freedom, its primary virtue is authenticity.[6] In the view of the existentialist, the individual’s starting point is characterized by what has been called “the existential angst” (or variably, existential attitude, dread, etc.), or a sense of disorientation, confusion, or dread in the face of an apparently meaningless or absurd world.[7] Many existentialists have also regarded traditional systematic or academic philosophies, in both style and content, as too abstract and remote from concrete human experience.”

For the last two years, our immediate family has kept a Google Hangout going.  Sometimes the conversation is serious and sometimes it is a place for sharing the joys of daily life. Triggered by a meme on Facebook, I started this sequence of existential questions:

Answer to life?

Of course, this question immediately creates a follow on alternative answer: “42”.

WHAT DOES 42 MEAN?

42 is the answer to the “ultimate question of life, the universe, and everything,” a joke in Douglas Adams’s 1979 novel, The Hitchhiker’s Guide to the Galaxy.

Gregory Bateson describes another answer to all of life in Mind and Nature:

“There is a story which I have used before and shall use again: A man wanted to know about mind, not in nature, but in his private large computer. He asked it (no doubt in his best Fortran), “Do you compute that you will ever think like a human being?” The machine then set to work to analyze its own computational habits. Finally, the machine printed its answer on a piece of paper, as such machines do. The man ran to get the answer and found, neatly typed, the words:

“THAT REMINDS ME OF A STORY”

“A story is a little knot or complex of that species of connectedness which we call relevance. In the 1960s, students were fighting for “relevance,” and I would assume that any A is relevant to any B if both A and B are parts or components of the same “story”. Again we face connectedness at more than one level: First, connection between A and B by virtue of their being components in the same story. And then, connectedness between people in that all think in terms of stories. (For surely the computer was right. This is indeed how people think.)”

With these inspirations, I started sharing a list of existential questions in the Age of V:

  1. What does ESPN do on Sports Center if there are no live sports?
  2. What do Fox News commentators do when our narcissistic President finally admits there is a corona virus crisis?
  3. Can a Trump Administration report be official without Sharpie markup?
  4. Can software adhere to the philosophy and values of the Bauhaus or do only physical objects count?   [Note reading iBauhaus: The iPhone as the Embodiment of Bauhaus Ideals and Design.]
  5. How clean and dressed up do you need to be to watch a live stream of a Catholic Mass?

President Trump Markups

As Day 14 of our shelter-in-place marches on in the Age of V, my thoughts turn to the implications of this crisis.  As I do, Amazon recommendations point me to the recently published The Precipice: Existential Risk and the Future of Humanity by Toby Ord.

“This is a book about existential risks—risks that threaten the destruction of humanity’s longterm potential. Extinction is the most obvious way humanity’s entire potential could be destroyed, but there are others. If civilization across the globe were to suffer a truly unrecoverable collapse, that too would destroy our longterm potential. And we shall see that there are dystopian possibilities as well: ways we might get locked into a failed world with no way back.

“The book aspires to start closing the gap between our wisdom and power, allowing humanity a clear view of what is at stake, so that we will make the choices necessary to safeguard our future.

“In ecological terms, it is not a human that is remarkable, but humanity. Each human’s ability to cooperate with the dozens of other people in their band was unique among large animals. It allowed us to form something greater than ourselves. As our language grew in expressiveness and abstraction, we were able to make the most of such groupings: pooling together our knowledge, our ideas and our plans.

“Crucially, we were able to cooperate across time as well as space. If each generation had to learn everything anew, then even a crude iron shovel would have been forever beyond our technological reach. But we learned from our ancestors, added minor innovations of our own, and passed this all down to our children. Instead of dozens of humans in cooperation, we had tens of thousands, cooperating across the generations, preserving and improving ideas through deep time. Little by little, our knowledge and our culture grew.

Ord, Toby. The Precipice (pp. 12-13). Hachette Books. Kindle Edition.

I love the introduction – “this book aspires to start closing the gap between our wisdom and our power.”

This book is going to take a while to read, to ponder, and to let ferment in my being.

In the meantime, I am ready for some existential interactions with my grand children.

The Cousins


Posted in Biodynamic, Flipped Perspective, Lifelet, WUKID | 1 Comment

From my chair: Tending the vines of life

I am immersing myself in all things Camino.  During the V crisis, I have dreams of walking the Camino de Santiago a year from now.  This morning I am reading Walk in a Relaxed Manner: Life Lessons from the Camino by Joyce Rupp.

As she walked through the vineyards in Rioja, Spain, she shared this Vintner’s Ode poem:

“Back of the vines is the vintner,
and back through the years his skill,
and back of it all are the vines in the sun,
and the rain and the Master’s will.”

I put my kindle down and paged through my memories of the many vineyards I’ve walked, the vineyard managers I’ve learned from, and the vintners who turn this gift of nature into wine.

Tending the vines of Life

As I flip through my google photos, a message pops up with a collage of photos from six years ago from the memorial to Alan York, my favorite biodynamic guru.

Alan York Memorial

I remember how much Alan taught me about the biodynamics of nature and fine wine growing.  He taught me how to “Wake UP!” and be in the active presence of nature:

As Alan and I were walking through the Cowhorn vineyards, I stopped dead in my tracks and almost shouted at Alan “One of the vines near me is diseased.  There is something wrong.  I CAN FEEL IT!”  He got this great big smile and said “I’ll be damned.  You, the knowledge book learning dude, have been paying attention to the experiential learning, not just the book learning.  Yes, the vine to your right is indeed diseased.  Let’s dig through the dirt to expose some of the roots and I will show you the disease pressure that this vine is under.  I am amazed that you could feel what was going on below the ground.”  Sure enough we could see the disease and it was the only vine in 40 acres that had this problem.  This experience was the outcome of monthly biodynamic day long seminars with some of the best grape growers and wine makers in Sonoma and Napa that I attended for most of two years.

May you rest in peace, Alan York, while the rest of us tend to the roots of the living.


Posted in Biodynamic, From My Chair, Learning, Nature, PhotoSynthesis, Reflecting, Wake Up! | Leave a comment

Ground Hog Days in the Age of V

I laughed at my liberal arts colleagues coming back from their Freshman philosophy class with this quote:

“No man ever steps in the same river twice, for it’s not the same river and he’s not the same man.” – Heraclitus

I retorted “Can you ever step into the same river once?”

Like all good dorm conversations, arguments ensued.  Beer helped.

As we enter Day 10 of self-quarantine and the flow of sameness, I reflect on are we encountering the same day again?

My head hurt so I finished up a painting experiment in my flow series.

Flow series of painting experiments

While it is a part of a series, I could not create the “same” painting if I tried.

Similarly as I continue with my octopus decaying stump and sunrise series, the photographs are never the same.  They might be related, but they are not the same.

Decaying octopus stump series

Sunrise series

The days pass.  We pray for those less fortunate.  We honor and affirm all of the health care workers and first responders who choose to be at the forefront of the V.

We help by staying socially isolated, yet awake to the wonders of the world surrounding us.

Posted in Biodynamic, Flipped Perspective, Learning, Nature, PhotoSynthesis | Leave a comment